Download
1 / 11
140 likes | 492 Views
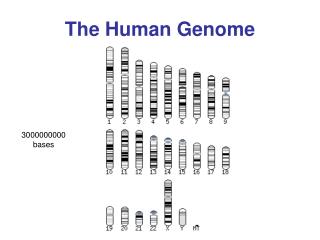
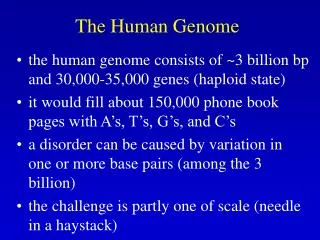
Patterns of Linkage Disequilibrium in the Human Genome. Chris Levasseur BI 820 March 30, 2003. Linkage Disequilibrium (LD). Particular alleles at neighboring loci tend to be co-inherited. For tightly linked loci this can lead to associations between alleles in the population - LD

E N D
Patterns of Linkage Disequilibrium in the Human Genome Chris Levasseur BI 820 March 30, 2003
Linkage Disequilibrium (LD) • Particular alleles at neighboring loci tend to be co-inherited. For tightly linked loci this can lead to associations between alleles in the population - LD • Might facilitate mapping of complex disease loci through whole-genome association studies
Quantifying Linkage Disequilibrium (D) D = PAB - (PA X PB) A,a and A,b: two alleles at two adjacent loci (A and B) PAB: frequency of the haplotype of alleles A and B PA: frequency of A at the first locus PB: frequency of B at the second locus 0 < D < PAB Raw measurement of Disequilibrium
Absolute Value of Disequilibrium (D’) D depends on allele frequencies D’ = (PAB - PA X PB) / (PA X PB) D’ = 1 if, and only if 2 SNPs have not been separated by recombination during history of the sample (complete LD) If D’ < 1 then the complete ancestral LD has been disrupted If D’ = 0 then there is complete linkage equilibrium * D’ normalizes LD to be between 0 and 1
Quantifying LD Decay Dt = (1 - r)tD0 t = time r = recombination fraction between markers D0 = extent of disequilibrium @ starting point Dt = extent of disequilibrium t generations later
Factors That Influence LD Collapse Bottleneck Diversity LD
Factors That Influence LD Expansion Diversity LD
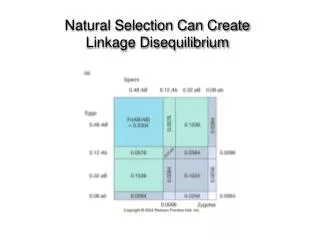
Factors That Influence LD Natural selection Positive selection = LD
Conclusions • Lots of variability in the extent of LD from one region of genome to another. • Even in a region of high LD, some pairs of loci do not show useful levels of LD due to gene conversions, allele frequency, etc. • Do not know if patterns of LD in one pop. will be replicated in other pops. w/ differing histories • Many forces shape the patterns of LD in humans (both molecular and demographic forces).