Download
1 / 19
190 likes | 309 Views
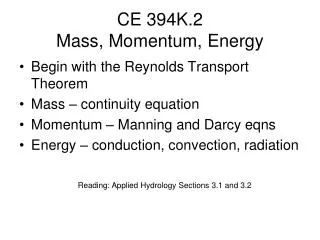
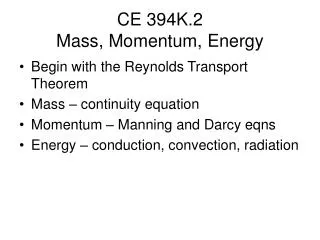
Nutrient Dynamics along the Caribbean Coast of the Yucatan Peninsula, Mexico: Monitoring for Potential Impacts of Development. Sarah Wallace CE 394K December 2, 2008. Outline. Introduction Questions Study sites Methods Results Conclusions (or further questions!). Introduction.

E N D
Nutrient Dynamics along the Caribbean Coast of the Yucatan Peninsula, Mexico: Monitoring for Potential Impacts of Development Sarah Wallace CE 394K December 2, 2008
Outline • Introduction • Questions • Study sites • Methods • Results • Conclusions (or further questions!)
Introduction • Water quality parameters directly influence ecology • Rapid development along coastlines increases nutrient runoff • Eutrophication: overabundance ofnutrientsleads to rapid increase in primary production
Questions • Do the coastal water bodies of the Greater Akumal area show eutrophic conditions? • Can nutrient levels be linked to the increased development in the area?
How can we determine the source of nutrients? • ΔN15: measurement comparing N15:N14 in a sample • Both isotopes found in nature • Wastewater tends to have a heavy (high) N15 signal
Methods • Data gathered over two years: May-June 2005 and 2007 • Sonde data: Temperature, salinity, DO, pH • Water samples: NO3 • Tissue samples: Drift algal and seagrass ΔN15
Discussion • Difference in nutrient values between Northern and Southern sites • Nutrient levels appear linked to freshwater input • HOWEVER, high algal ΔN15 across GAA • Groundwater connectivity • Naturally N15 sediments
Improvements/ Future work • More data! • Integration of phosphorus/ammonium data • Investigate nutrient pulses • Transect study to trace “plumes” • Trophicinteractions!
Thank You! http://www.oceanrealmimages.com/gallery/main.php?g2_view=core.DownloadItem&g2_itemId=161&g2_serialNumber=5