Download
1 / 17
180 likes | 444 Views
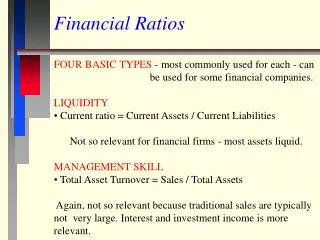
Strategic Management Financial Ratios. Strategic Ratios. Profit Ratios Liquidity Ratios Activity Ratios Leverage Ratios Shareholder-Return Ratios. Profit Ratios.

E N D
Strategic Ratios • Profit Ratios • Liquidity Ratios • Activity Ratios • Leverage Ratios • Shareholder-Return Ratios
Profit Ratios • Profit Ratios: Profit ratios measure the efficiency with which the company uses its resources. The more efficient the company, the greater is its profitability. It is useful to compare a company's profitability against that of its major competitors in its industry. Such a comparison tells whether the company is operating more or less efficiently than its rivals. In addition, the change in a company's profit ratios over time tells whether its performance is improving or declining.
Profit Ratios (Continued) • Gross profit margin. The gross profit margin simply gives the percentage of sales available to cover general and administrative expenses and other operating costs. Gross Profit Margin = Sales Revenue - Cost of Goods Sold Sales Revenue
Profit Ratios (Continued) • Net profit margin. Net profit margin is the percentage of profit earned on sales. This ratio is important because businesses need to make a profit to survive in the long run. Net Profit Margin = Net Income Sales Revenue
Profit Ratios (Continued) • Return on total assets. This ratio measures the profit earned on the employment of assets. Return on Total Assets = Net Income Available to Common Stockholders Total Assets Net income is the profit after preferred dividends (those set by contract) have been paid. Total assets include both current and non-current assets.
Profit Ratios (Continued) • Return on stockholders' equity. This ratio measures the percentage of profit earned on common stockholders' investment in the company. In theory, a company attempting to maximize the wealth of its stockholders should be trying to maximize this ratio. Return on Stockholders' Equity = Net Income Available to Common Stockholders Stockholders' Equity
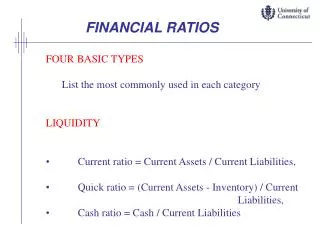
Liquidity Ratios • A company's liquidity is a measure of its ability to meet short-term obligations. An asset is deemed liquid if it can be readily converted into cash. Liquid assets are current assets such as cash, marketable securities, accounts receivable, and so on.
Liquidity Ratios (Continued) • Current ratio. The current ratio measures the extent to which the claims of short-term creditors are covered by assets that can be quickly converted into cash. Most companies should have a ratio of at least 1, because failure to meet these commitments can lead to bankruptcy. Current Ratio = Current Assets Current Liabilities
Liquidity Ratios (Continued) • Quick ratio. The quick ratio measures a company's ability to payoff the claims of short-term creditors without relying on the sale of its inventories. This is a valuable measure since in practice the sale of inventories is often difficult. Quick Ratio = Current Assets - Inventory Current Liabilities
Activity Ratios • Activity ratios indicate how effectively a company is managing its assets • Inventory turnover. This measures the number of times inventory is turned over. It is useful in determining whether a firm is carrying excess stock in inventory. • Days sales outstanding (DSO), or average collection period. This ratio is the average time a company has to wait to receive its cash after making a sale. It measures how effective the company's credit, billing, and collection procedures are.
Leverage Ratios • A company is said to be highly leveraged if it uses more debt than equity, including stock and retained earnings. The balance between debt and equity is called the capital structure. The optimal capital structure is determined by the individual company. • Debt has a lower cost because creditors take less risk; they know they will get their interest and principal. However, debt can be risky to the firm because if enough profit is not made to cover the interest and principal payments, bankruptcy can occur.
Leverage Ratios (Continued) • Debt-to-assets ratio. The debt-to-asset ratio is the most direct measure of the extent to which borrowed funds have been used to finance a company's investments. It is defined as follows: Debt-to-Assets Ratio = Total Debt Total Assets Total debt is the sum of a company's current liabilities and its long-term debt, and total assets are the sum of fixed assets and current assets.
Leverage Ratios (Continued) • Debt-to-equity ratio. The debt-to-equity ratio indicates the balance between debt and equity in a company's capital structure. This is perhaps the most widely used measure of a company's leverage. It is defined as follows: Debt-to-Equity Ratio = Total Debt Total Equity
Shareholder-Return Ratios • Shareholder-return ratios measure the return earned by shareholders from holding stock in the company. Given the goal of maximizing stockholders' wealth, providing shareholders with an adequate rate of return is a primary objective of most companies. As with profit ratios, it can be helpful to compare a company's shareholders returns against those of similar companies. This provides a yardstick for determining how well the company is satisfying the demands of this particularly important group of organizational constituents.
Shareholder-Return Ratios (Continued) • Price-earnings ratio. The price-earnings ratio measures the amount investors are willing to pay per dollar of profit. Price-Earnings Ratio = Market Price per Share Earnings per Share
Shareholder-Return Ratios (Continued) • Market to book value. Another useful ratio is market to book value. This measures a company's expected future growth prospects. Market to Book Value = Market Price per Share Book value per share of equity