Download

1 / 27
280 likes | 434 Views
Basics of thematic mapping in GIS ( ArcMap ) Kelly Clonts Presentation for UC Berkeley, D-Lab October 29 th , 2014. 1. Data files. Download Zip file: tinyurl.com/dlab-gis1 (Just in case that doesn’t work): dropbox.com/s/kzpxpddqh4u06h0/ Dlab.zip?dl =0

E N D
Basics of thematic mapping in GIS (ArcMap) Kelly Clonts Presentation for UC Berkeley, D-Lab October 29th, 2014
1. Data files Download Zip file: tinyurl.com/dlab-gis1 (Just in case that doesn’t work): dropbox.com/s/kzpxpddqh4u06h0/Dlab.zip?dl=0 Open download and extract the files to a folder in an easy to find location
Learning Objectives • What you will learn • What a thematic map is • Where to find appropriate data • How to download and format data in Excel • How to join Census data to Shapefiles(geographic data) based on shared IDs • How to create thematics maps • You are not learning the basics GIS, just how to use the tool for certain tasks (however, you are not required to have prior GIS experience)
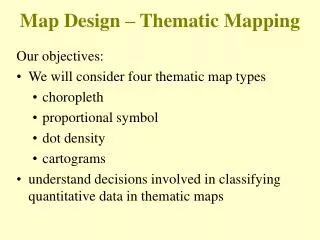
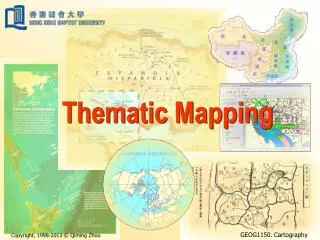
What is a thematic map? • Also called a “cloropleth map” or “heat map” • Similar to a “heat map” • Best used when you have defined areas • Best used when you can group the data into 3-6 categories.
What is a thematic map? • Heat Map: “thematicapplication as a choropleth map.” • Not discrete amounts or categories
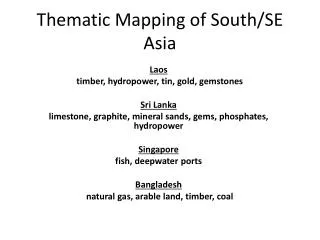
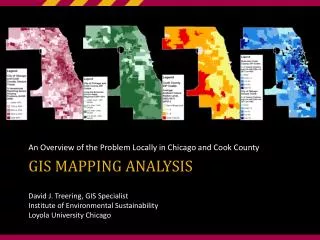
What will we be doing? • We will create a map that shows the density of Households in SF by Census Block. • Show you the steps to create a map that shows the distribution/density/number of (demographic data) in (geographic location)by (discrete area size). • Density of minority races in Alameda County by Census tract • Means of transportation to work in Berkeley by Census Block Group • Population density in California by County
1. Data files We will create a map that shows the density of Households in SF by Census Block. So what do we need? • Households data in SF • Census block shapes in SF
What will we be doing? Overview • Find the data files • Open shapefile in GIS • Join Geographic data with Attribute data using a common ID • Categorize and map data
1. Data files • Geographic information (GIS shapefile) • This data can be found on the US Census TIGER website: https://www.census.gov/geo/maps-data/data/tiger-line.html • Tiger/line shapefiles > 2013 > Download > web interface > blocks >california • Download and Extract (to an easy-to-find location) • Demographic information (Excel/.CSV) • This data can be found on the US Census Factfinder2 Website http://factfinder2.census.gov/faces/nav/jsf/pages/index.xhtml • Advanced Search > Show me All • Geographies > Name > “block” “San Francisco” • Select: all Blocks within San Francisco County, California • In search: “housing units” (or H1), Download file • Download and Extract (to an easy-to-find location)
1. Data files • Download and Extract (to an easy-to-find location) • .dbf (attribute data – think of it as an excel file) • .prj (projection – open in notepad) • .shp (geometry data) • .sph.xml (ArcMap’s file) • .shx (index file)
2. GIS Start ArcMap • Start menu – All Programs – ArcMap10.1 • Add data, select shapefile and excel file
2. GIS: Basic Tools • Check projection: • View > Data Frame Properties • NAD 1983 StatePlane California III FIPS 0403
2. GIS: Basic Tools • Explore toolbars • Layout vs. data view • Table of Contents • layers in “List by Drawing Order,” “List by Source,” “List by Visibility” and “List by Selection”. • Layers on bottom = below / top = above • Zoom: mouse, zoom toolbar, and right click • Customize>ArcMap Options… (for changing mouse zoom) To measure, click the ruler, then click your map. Options to change units will appear
2. GIS: Basic Tools • Toolbars: Customize>Toolbars (if the toolbars aren’t already there) • Selection Tool • Editing session The toolbar: zoom in/out, move, select, information, measure options and more
2. GIS: Basic Tools • Calculate Area of each Polygon • Right click > open attributes table • Table > Add Field
2. GIS • Right click Area > Calculate Geometry
CENSUS DATA FILE Census Data • Can Only have 1 column, specific naming rules • begin with a letter (not a number!) • no more than 64 characters • may not consist solely of reserved words (these are typically very simple, such as: date, name, text, year) • Need to create a “Block” column that matches our GIS data
CENSUS DATA FILE What ID number do we use? • Find an ID number on your shapefile that matches one on your spreadsheet • We need to make sure these numbers match exactly
CENSUS DATA FILE • What ID number do we use? • Need to create a new column with a “0” in from of the GEO.id2 (or Id2) • Create new column, called “Id3” • Go to Number > Custom > Type > 0 • Type a new formula, =0&B2 to create new ID number • Drag down to all cells • Save file
3. Join Data • Add Spreadsheet data to ArcMap
3. Join Data • Join data • Choose Block ID field on both files
4. Create Map • Right click on your map layer with joined data • Go to Properties
4. Create Map • Go to Symbology > Quantities • Select Households and Normalize by Area • Experiment with different kinds of breaks (under classification)
4. Create Map • You can change the colors of your map by clicking on the colored box in the Table of Contents
4. Create Map • Go to the Layout View, add a table of contents • Export > Illustrator or PDF
Resources http://resources.arcgis.com/