1 / 27

Cross-Plots and Histograms of Tilted Block Dimensions in Iceland

This supplement to the article "Large near-surface block rotations at normal faults of the Iceland rift: evolution of tectonic caves and dilatancy" by Kettermann et al., 2019 contains cross-plots and histograms of measured tilted block dimensions derived from field data in Iceland.

rbrunet
Download Presentation

Cross-Plots and Histograms of Tilted Block Dimensions in Iceland

An Image/Link below is provided (as is) to download presentation Download Policy: Content on the Website is provided to you AS IS for your information and personal use and may not be sold / licensed / shared on other websites without getting consent from its author. Content is provided to you AS IS for your information and personal use only. Download presentation by click this link. While downloading, if for some reason you are not able to download a presentation, the publisher may have deleted the file from their server. During download, if you can't get a presentation, the file might be deleted by the publisher.

E N D

Presentation Transcript


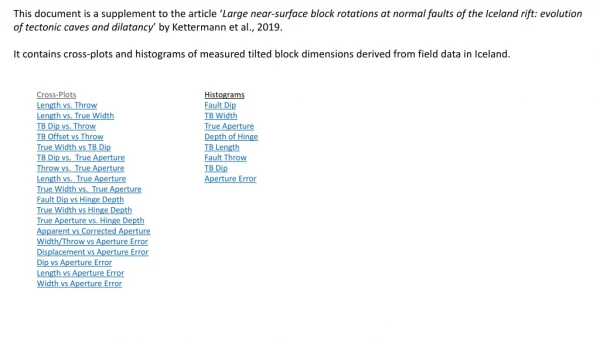
  1. This document is a supplement to the article ‘Large near-surface block rotations at normal faults of the Iceland rift: evolution of tectonic caves and dilatancy’ by Kettermann et al., 2019. It contains cross-plots and histograms of measured tilted block dimensions derived from field data in Iceland. Cross-Plots Length vs. Throw Length vs. True Width TB Dip vs. Throw TB Offset vs Throw True Width vs TB Dip TB Dip vs. True Aperture Throw vs. True Aperture Length vs. True Aperture True Width vs. True Aperture Fault Dip vs Hinge Depth True Width vs Hinge Depth True Aperture vs. Hinge Depth Apparent vsCorrectedAperture Width/Throw vsAperture Error Displacement vsAperture Error Dip vsAperture Error Length vsAperture Error Width vsAperture Error Histograms Fault Dip TB Width True Aperture Depth of Hinge TB Length Fault Throw TB Dip Aperture Error

  2. Fig. 1: Crossplot of TB Dip vs. Fault Throw

  3. Fig. 2: Crossplot of TB Width vs. TB Surface Dip

  4. Fig. 3: Crossplot of TB Dip vs. Corrected Aperture

  5. Fig. 4: Crossplot of TB Offset vs. Fault Throw

  6. Fig. 5: Crossplot of Fault Throw vs. Corrected Aperture

  7. Fig. 6: Crossplot of TB Length vs. Corrected Width

  8. Fig. 7: Crossplot of Fault Dip vs. Hinge Depth

  9. Fig. 8: Crossplot of Corrected TB Width vs. Hinge Depth

  10. Fig. 9: Crossplot of TB Length vs. Fault Throw

  11. Fig. 10: Crossplot of Apparent vs. Corrected Aperture

  12. Fig. 11: Crossplot of TB Length vs. Corrected Aperture

  13. Fig. 12: Crossplot of Corrected TB Width vs. Corrected Aperture

  14. Fig. 13: Crossplot of Width/Throw vs. Error in Aperture

  15. Fig. 14: Crossplot of Fault Throw vs. Aperture Error

  16. Fig. 15: Crossplot of TB Dip vs. Aperture Error

  17. Fig. 16: Crossplot of TB Length vs. Aperture Error

  18. Fig. 17: Crossplot of TB Width vs. Aperture Error

  19. Fig. 18: Crossplot of Hinge Depth vs. Corrected Aperture

  20. Fault dip [°] Fig. 19: Histogram of calculated fault dips

  21. TB Width [m] Fig. 20: Histogram of TB widths

  22. True aperture [m] Fig. 21: Histogram of corrected aperture

  23. Depth of hinge [m] Fig. 22: Histogram of hinge depths

  24. TB length [m] Fig. 23: Histogram of TB lengths

  25. Fault throw [m] Fig. 24: Histogram of fault throws

  26. TB dip [°] Fig. 25: Histogram of TB surface dips

  27. Aperture error [m] Fig. 26: Histogram of aperture errors

More Related