Download

1 / 49
490 likes | 507 Views
Learn about the common mistakes students make in inferential statistics and how to avoid them. Get tips on hypotheses, conclusions, and more.

E N D
Tools for Two Common Student Mistakes on the AP Exam Dr. Robert Taylor Dr. Ellen Breazel Dr. Julia Sharp Clemson University
Breazel Activities in AP Statistics AP Statistics Readings Reader 2007, 2009, 2010, 2011 Table Leader 2012 Hosted Professional Development Events Activities for the Classroom, Clemson – 2011 Practice Exam, Clemson - 2012 AP Workshop – Greenville, SC - 2011 Five Day College Board Workshops SC AP Statistics Institutes , Clemson - 2009 Curriculum Module – Editor and Author – 2012 Topic – Random Assignment & Random Sampling 4/25
Taylor Activities in AP Statistics AP Statistics Readings Reader 2000, 2001, 2002 Table Leader 2004, 2005, 2006 Question Leader 2007, 2010, 2011, 2012 Asst Chief Reader 2008, 2009 Test Development Committee 2007-2013 Chair/Co-Chair of Test Devel. Comm. 2010-2013 AP Workshops (5 days) at UGA 2000, 2001, 2002, 2004, 2006 4/25
Activities in AP Statistics -cont AP Workshop (1 day) at Oglethrope College Jan. 2002 AP Workshop (1 day) at Greenville, SC Oct. 2003 AP Workshop (1 day) at Columbia, SC Feb. 2005 AP Workshop (1 day) at Spartanburg Oct. 2006 AP Workshop (1 day) at Columbia, SC Feb. 2008 AP Workshop (1 day) at Charlotte, NC Feb. 2009 AP Workshop (1 day) at Jacksonville, FL Oct. 2010 AP Workshop (1 day) at Nashville, TN Oct. 2011 AP Workshop (1 day) at Atlanta Jan. 2012 Five Day College Board Workshops SC AP Statistics Institutes , Clemson – (7 cons. Yrs) 2005 -2011 AP Workshop at Carleton College, MN June 22-25, 2009 AP Workshop at Maryville College, TN July 5-10, 2009, July 2010 5/25
Inferential Statistics Definition: Inferential Statistics refers to methods of making decisions or predictions about a population, based on data obtained from a sample of that population. (Statistics The Art and Science of Learning from Data – Agresti/Franklin)
Common Steps for Inferential Statistics Confidence Intervals (3 parts) • Assumptions • Calculations • Summary Hypothesis Tests (4 parts) • Hypotheses • Assumptions • Testing • Summary
Where do Students Go Wrong? Hypotheses: 2 different ways • Use symbols for sample statistics rather than population parameters • Incorrectly define population parameter symbols
AP Statistics Exam 2004 – Question 5 A rural county hospital offers several health services. The hospital administrators conducted a poll to determine whether the residents’ satisfaction with the available services depends on their gender… a. Using a sig. level of 0.05, conduct an appropriate test to determine if, for adult residents of the county, there is an association between gender and whether or not they were satisfied with services offered by the hospital
a. Using a sig. level of 0.05, conduct an appropriate test to determine if, for adult residents of the county, there is an association between gender and whether or not they were satisfied with services offered by the hospital
Where do Students Go Wrong? Hypotheses: • Use symbols for sample statistics rather than population parameters • Incorrectly define population parameter symbols
a. Using a sig. level of 0.05, conduct an appropriate test to determine if, for adult residents of the county, there is an association between gender and whether or not they were satisfied with services offered by the hospital Even without the sample size – this statement is not clear and will often not receive credit
Where Do Students Go Wrong? Conclusions: • Mixing Sample and Population • Using p-hat for p-value
AP Statistics Exam 2011 – Question 4 - Cholesterol High cholesterol levels in people can be reduced by exercise, diet, and medication. Twenty middle-aged males with cholesterol readings between 220 and 240 (mg/dL) of blood were randomly selected from the population of such male patients at a large local hospital. Ten of the 20 males were randomly assigned to group A, advised on appropriate exercise, diet, and also received a placebo. The other 10 males were assigned to group B, received the same advice on appropriate exercise and diet, but received the drug intended to reduce cholesterol instead of a placebo……. Do the data provide convincing evidence, at the α = 0.01 level, that the cholesterol drug is effective in producing a reduction in mean cholesterol level beyond that produced by exercise and diet?
Do the data provide convincing evidence, at the α = 0.01 level, that the cholesterol drug is effective in producing a reduction in mean cholesterol level beyond that produced by exercise and diet? Where is the parameter of interest?
Where Do Students Go Wrong? Conclusions: • Mixing Sample and Population • Using p-hat for p-value
AP Statistics Exam 2005 – Question 4 Some boxes of a certain brand of breakfast cereal include a voucher for a free video rental inside the box. The company that makes the cereal claims that a voucher can be found in 20 percent of the boxes….. This group of students purchased 65 boxes of cereal to investigate the company’s claim. The students found a total of 11 vouchers for free video rentals in the 65 boxes. ….Based on this sample, is there support for the students’ belief that the proportion of boxes with vouchers is less than 0.2? Provide statistical evidence to support your answer.
Actually the p-hat value ….Based on this sample, is there support for the students’ belief that the proportion of boxes with vouchers is less than 0.2? Provide statistical evidence to support your answer. population
ActivitySampling from a Population Situation: A Sociology class is interested in the average number of Facebook friends for MSSU (a fictitious college). The university actually has obtained this information from all its students however they are not willing to give out their data in electronic form. All the Sociology class was able to obtain was a paper copy of the data. The class believes that the average number of friends is around 855. Conduct an appropriate test for the classes guess.
State the null and alternative hypothesis of your test. Be sure to define any parameters used. Where µ represents the population mean number of Facebook friends at MSSU
Calculate the mean and standard deviation of the number of FB friends from your sample and label properly. What is the test statistic for your hypothesis test?
At the 5% significance level, what conclusions can you make about the Sociology classes guess on the number of FB from this college? At the 5% significance level the p-value (0.8546) is very large (greater than alpha = 0.05) therefore we do not reject the null hypothesis. There is insufficient evidence to suggest the average number of Facebook friends of all MSSU students is different from 855.
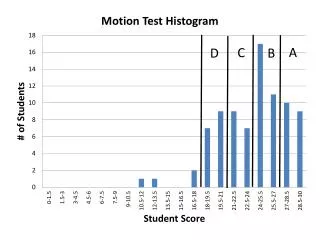
Optional Class Discussions/Activities • On your green post it note write your sample mean. Have a member of your group place the sample mean on the number line at the front of the class. • On your yellow post it note write whether you Rejected your null hypothesis or not. Place your post-it in the proper place in the table at the front of the class. • What shape does the greenpost-it note histogram form for the class? • What shape will the histogram form if we were to have 3000 groups in the class? Why? [link] • If we had 3000 groups what percentage of those groups would reject the null hypothesis for their hypothesis test (if the null hypothesis is true)?
Why is this activity helpful? • Students have a difficult time understanding an intangible Population • Large enough population – with a realistic application • Can also look at Confidence Intervals • Good exercise to review sampling distribution • Opportunity to talk about 10% of population rule • Gives overview of entire inference process.
Since AP Statistics emphasizes conceptual understanding and communication, long computational mechanics are often provided in AP Statistics Exam questions. This frequently takesthe form of computer output which the student must be able to read and interpret in the context of the problem. Recent examples of questions where computer output have related to regression problemsand these include: • Question 3, 2005, The Great Plains Railroad • Question 6, 2001, Science Performance in a Magnet School • Question 5, 2011, Windmill.
It is also common for the calculated test statistic or the p-value to be provided for the student: • Question 5, 2012, “p-value of 0.97” • Question 3, 2010, “… the resulting confidence interval was 0.417+ 0.119.” • Question 6, 2010, “Frequency Plot of Simulated Values of the Test Statistic Q.” • Question 5, 2009, “… resulted in a p-value of 0.97” • Question 6, 2009, “A dotplot of 100 simulated values of the test statistic sample mean / sample median.”
The common goal in all of these questions • focus the student on relating the statistical concepts and results to a problem in context • provide some of the time-consuming mechanics of the statistical calculations. The computer output is intended to be as generic as possible but invariably will contain some of traces of the particular software package which was used. Thus, it is important that students can accurately and comfortablyinterpret statistics from various computer output.
The focus of the second half of this presentation will be to review different of computer outputs with the goal of trying to identify the desired statistical calculations. The software packages which will be used are: • Minitab • SAS • SPSS • R
Generic Problem Twelve randomly selected homes sold in a nearby county were selected to examine the relationship between the x= size (in square feet) and y=price (in dollars) of the houses. Below is a scatterplot of the data: Qn 1. Do the data indicate that there may be a linear relation between size of house (in square feet) and the price of a house?
Answer to Qn 1. From the scatterplot there appears to be a fairly strong, positive linear relation between size of house (in square feet) and the price of a house. Moreover, the residual plot shows no discernible pattern. Hence, it is reasonable to proceed with a linear regression analysis to predict price of houses by the size of houses.
Answer to Qn 2. The regression equation is Predicted Price of House (in dollars) = $31,547 + 111*Size of House (in sqft). Qn 2. Using the computer output, determine the equation of the least squares regression line. Identify all variables used in the equation.
Qn 3. What is the estimated price of a home that is 2500 square feet? Answer to Qn 2. The regression equation is Predicted Price of House (in dollars) = $31,547 + 111*Size of House (in sqft). Answer to Qn 3. The Predicted Price of a House that is 2500 square feet is= $31,547 + 111*(2500) = $309,047. Qn 4. What proportion of the variation in house price is explained by its linear relationship with house size? Answer to Qn 4. 96.9% of the variation in house prices can be explained by a linear relationship with the size of the house in square feet.
Adjusted R2 is the percentage of response variable variation that is explained by its relationship with one or more predictor variables, adjusted for the number of predictors in the model. R2 will always increase when a new term is added, and hence, a model with more terms may appear to have a better fit simply because it has more terms. The adjusted R2will increase only if the new term improves the model more than expected by chance. It decreases when a predictor improves the model less than expected by chance. Qn 5 What is the difference between R2 and adjusted R2 ?
Predicted Price of House = $29,842 + 128*Size of House – 12,501*Bedrooms Note that adjusted R2 decreased from 96.6 to 96.43 when the variable ‘number of bedrooms’ was added.
A strong positive linear relationship between price and number of bedrooms. A strong positive linear relationship between number of bedrooms and size of house. Thus, adding the number of bedrooms add very little to predicting house price when size of house is in the model.
Qn 6. Interpret the value of the estimated slope in the context of this problem and construct a 95% confidence interval for the model of the population model. Answer to Qn 6. The estimated slope is $111 per square foot. Thus, we would expect a $111 increase in the price of the house (on the average) for each square foot increase in house size.
The population linear regression model is Y = α + βX + ε Ydenotes the price of the houses Xdenotes the size of the houses αis the y-intercept βis the slope of the regression model εdenotes random error Inferences for linear regression depends on the condition that ε is normally distributed with mean 0 and variance σ2. The residuals are the best estimates for the error terms.
Only Slightly Skewed Right Reasonable to assume error terms are approximately normal No Outliers
C.I. for slope point estimate for slope + (t-value*standard error of slope) 111 + (2.228*6.256) = 111 + (13.94) Thus, we are 95% confidence that the population slope for the increase in house price per unit increase in square footage is between $97.06 and $124.94.
Qn 7 Is there statistically convincing evidence that house price is related to house size? Explain. Answer to Qn 7. The question is whether the population slope β is 0. Since a 95% confidence interval is significantly distanced from 0, there is very strong evidence that the population slope β ≠ 0. The t-statistic = Estimated slope/ standard error of the slope = (111 – 0)/6.265 = 17.77, p-value ≈ .000000003 provides very strong evidence to reject Ho: β = 0 in favor of Ha: β ≠ 0. This test of hypothesis is equivalent to the test that the population correlation is 0.
Qn 8. For each of the following outputs, identify • The estimated slope • The standard error of the estimated slope • The estimated intercept • The standard error of the estimated intercept • R2 • adjusted R2 • the estimated standard deviation of linear regression • the evidence that house price is related to house size
The estimated slope • The standard error of the estimated slope • The estimated intercept • The standard error of the estimated intercept • R2 • adjusted R2 • the estimated standard deviation of linear regression • the evidence that house price is related to house size
The estimated slope • The standard error of the estimated slope • The estimated intercept • The standard error of the estimated intercept • R2 • adjusted R2 • the estimated standard deviation of linear regression • the evidence that house price is related to house size
The estimated slope • The standard error of the estimated slope • The estimated intercept • The standard error of the estimated intercept • R2 • adjusted R2 • the estimated standard deviation of linear regression • the evidence that house price is related to house size
The estimated slope • The standard error of the estimated slope • The estimated intercept • The standard error of the estimated intercept • R2 • adjusted R2 • the estimated standard deviation of linear regression • the evidence that house price is related to house size
Contacts • Bob Taylor rtaylo2@clemson.edu • Ellen Breazel ehepfer@clemson.edu • Slides and other resources www.clemson.edu/~ehepfer (Click on AP Stats)