Download
1 / 41
430 likes | 530 Views
This chapter explores the theory of monetary policy within the aggregate demand-aggregate supply framework, examining policy choices during demand and supply shocks, lags in policy implementation, and the relationship between stabilizing inflation and economic activity. It delves into the challenges faced by policymakers at the zero lower bound and discusses responses to various shocks, emphasizing the tradeoffs involved in policy decisions. The debate between activists and nonactivists in pursuing economic stability is also addressed.

E N D
Chapter 24 Monetary Policy Theory
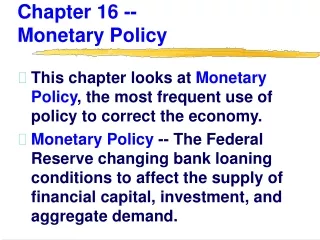
Preview • This chapter uses the aggregate demand-aggregate supply framework developed in the preceding chapter to develop a theory of monetary policy.
Learning Objectives • Illustrate and explain the policy choices that monetary policymakers face under the conditions of aggregate demand shocks, temporary supply shocks and permanent supply shocks. • Identify the lags in the policy process, and summarize why they weaken the case for an activist policy approach. • Explain why monetary policymakers can target any inflation rate in the long-run but cannot target aggregate output in the long-run.
Learning Objectives • Identify the sources of inflation and the role of monetary policy in propagating inflation. • Explain the unique challenges that monetary policymakers face at the zero lower bound, and illustrate how nonconventional monetary policy can be effective under such conditions.
Response of Monetary Policy to Shocks • Monetary policy should try to minimize the difference between inflation and the inflation target. • In the case of both demand shocks and permanent supply shocks, policy makers can simultaneously pursue price stability and stability in economic activity. • Following a temporary supply shock, however, policy makers can achieve either price stability or economic activity stability, but not both. This tradeoff poses a dilemma for central banks with dual mandates.
Response to an Aggregate Demand Shock • Policy makers can respond to this shock in two possible ways: • No policy response • Policy stabilizes economic activity and inflation in the short run • In the case of aggregate demand shocks, there is no tradeoff between the pursuit of price stability and economic activity stability.
Figure 2Aggregate Demand Shock: Policy Stabilizes Output and Inflation in the Short Run
Response to a Permanent Supply Shock • There are two possible policy responses to a permanent supply shock: - No policy response - Policy stabilizes inflation
Figure 4 Permanent Supply Shock: Policy Stabilizes Inflation
Response to a Temporary Supply Shock • When a supply shock is temporary, policymakers face a short-run tradeoff between stabilizing inflation and economic activity. • Policymakers can respond to the temporary supply shock in three possible ways: • No policy response • Policy stabilizes inflation in the short run • Policy stabilizes economic activity in the short run
Figure 5Response to a Temporary Aggregate Supply Shock: No Policy Response
Figure 6Response to a Temporary Aggregate Supply Shock: Short-Run Inflation Stabilization
Figure 7Response to a Temporary Aggregate Supply Shock: Short-Run Output Stabilization
The Bottom Line: The Relationship Between Stabilizing Inflation and Stabilizing Economic Activity • We can draw the following conclusions from this analysis: • If most shocks to the economy are aggregate demand shocks or permanent aggregate supply shocks, then policy that stabilizes inflation will also stabilize economic activity, even in the short run. • If temporary supply shocks are more common, then a central bank must choose between the two stabilization objectives in the short run. • In the long run there is no conflict between stabilizing inflation and economic activity in response to shocks.
How Actively Should Policy Makers Try to Stabilize Economic Activity? • All economists have similar policy goals (to promote high employment and price stability), yet they often disagree on the best approach to achieve those goals. • Nonactivists believe government action is unnecessary to eliminate unemployment. • Activists see the need for the government to pursue active policy to eliminate high unemployment when it develops.
Lags and Policy Implementation • Several types of lags prevent policymakers from shifting the aggregate demand curve instantaneously: • Data lag: the time it takes for policy makers to obtain data indicating what is happening in the economy • Recognition lag: the time it takes for policy makers to be sure of what the data are signaling about the future course of the economy
Lags and Policy Implementation • Several types of lags prevent policymakers from shifting the aggregate demand curve instantaneously: • Legislative lag: the time it takes to pass legislation to implement a particular policy • Implementation lag: the time it takes for policy makers to change policy instruments once they have decided on the new policy • Effectiveness lag: the time it takes for the policy actually to have an impact on the economy
FYI: The Activist/Nonactivist Debate Over the Obama Fiscal Stimulus Package • Many activists argued that the government needed to do more by implementing a massive fiscal stimulus package. • On the other hand, nonactivists opposed the fiscal stimulus package, arguing that fiscal stimulus would take too long to work because of long implementation lags. • The Obama administration came down squarely on the side of the activists and proposed the American Recovery and Reinvestment Act of 2009, a $787 billion fiscal stimulus package that Congress passed on February 13, 2009.
Inflation: Always and Everywhere a Monetary Phenomenon • This adage is supported by our aggregate demand and supply analysis because it shows that monetary policy makers can target any inflation rate in the long run by shifting the aggregate demand curve with autonomous monetary policy.
Causes of Inflationary Monetary Policy • High employment targets and inflation: • Cost-push inflation results either from a temporary negative supply shock or a push by workers for wage hikes beyond what productivity gains can justify. • Demand-pull inflation results from policy makers pursuing policies that increase aggregate demand.
Application: The Great Inflation • Now that we have examined the roots of inflationary monetary policy, we can investigate the causes of the rise in U.S. inflation from 1965 to 1982, a period dubbed the “Great Inflation”. • Panel (a) of Figure 11 documents the rise in inflation during those years. Just before the Great Inflation started, the inflation rate was below 2% at an annual rate; by the late 1970s, it averaged around 8% and peaked at nearly 14% in 1980 after the oil price shock in 1979. • Panel (b) of Figure 11 compares the actual unemployment rate to estimates of the natural rate of unemployment.
Monetary Policy at the Zero Lower Bound • The Fed can attempt to reduce the real interest rate by lowering the federal funds rate. • The federal funds rate, though, is stated in nominal terms, and therefore cannot fall below zero. • The zero floor on the federal funds rate is referred to as the zero lower bound.
Deriving the Aggregate Demand Curve with the Zero Lower Bound • The MP curve is normally upward sloping. • With the federal funds rate at the floor of zero, as inflation and expected inflation fall, the real interest rate rises, creating a downward slope for the MP curve. • The process described above creates a kink in the Aggregate Demand curve as well.
Figure 12 Derivation of the Aggregate Demand Curve with a Zero Bound
The Disappearance of the Self-Correcting Mechanism at the Zero Lower Bound • When the economy is in a situation in which equilibrium output is below potential output and the zero lower bound on the policy rate has been reached, output is not restored to its potential level if policymakers do nothing. • In addition, in this situation the economy goes into a deflationary spiral, characterized by continually falling inflation and output.
Figure 13 The Absence of the Self-Correcting Mechanism at the Zero Lower Bound
Application Nonconventional Monetary Policy and Quantitative Easing • Sometimes the negative aggregate demand shock is so large that at some point the central bank cannot lower the real interest rate further because the nominal interest rate hits a floor of zero, as occurred after the Lehman Brothers bankruptcy in late 2008. • In this situation when the zero-lower-bound problem arises, the central bank must turn to nonconventional monetary policy.
Application Nonconventional Monetary Policy and Quantitative Easing • Nonconventional monetary policy takes three forms: • Liquidity provision • Asset purchases (quantitative easing) • Management of expectations
Liquidity Provision • A central bank can bring down financial frictions directly by increasing its lending facilities in order to provide more liquidity to impaired markets so that they can return to their normal functions. • This decline in financial frictions lowers the real interest rate for investments.
Asset Purchases and Quantitative Easing • The monetary authorities can also lower financial frictions by lowering credit spreads through the purchase of private assets • Though the Fed took action, the negative. aggregate demand shock to the economy from the global financial crisis was so great that the Fed’s quantitative (credit) easing was insufficient to overcome it, and the Fed was unable to shift the aggregate demand curve all the way back and the economy still suffered a severe recession.
Management of Expectations • Forward guidance in which the central bank commits to keeping the policy rate low for a long period of time is another way of lowering long-term interest rates relative to short-term rates and thereby lowering financial frictions and the real interest rate for investments. • This can lead to both rightward shifts in aggregate demand and by shifting the short-run aggregate supply curve by raising expectations of inflation.
Abenomics and the Shift in Japanese Monetary Policy in 2013 • A major policy shift occurred in Japan with the election of Prime Minister Shinzo Abe. • First, the Bank of Japan was pressured to double its inflation target. • Second, the central bank engaged in a program of quantitative easing. • This two pronged attack would lower real interest rates while raising inflationary expectations.
Figure 16 Response to the Shift in Japanese Monetary Policy in 2013