Download
1 / 1
10 likes | 111 Views
Explore the enhanced capabilities of high-performance MALDI-TOF technology for tissue imaging. See how advancements like 5 kHz lasers and high-resolution analyzers revolutionize protein and lipid profiling in biological samples. This study showcases efficient data acquisition and imaging quality improvements.

E N D
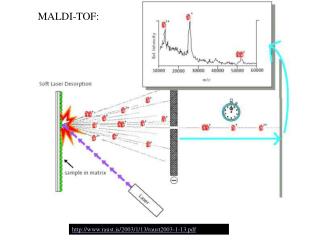
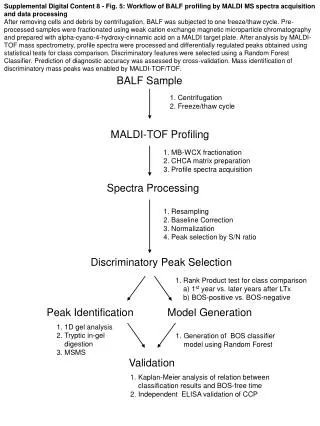
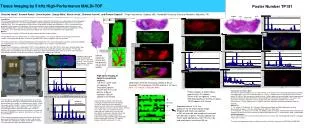
Tissue Imaging by 5 kHz High-Performance MALDI-TOF Poster Number TP191 Christina Vestal1, Kenneth Parker1, Kevin Hayden1, George Mills1, Marvin Vestal1, Shannon Cornett2, and Richard Caprioli2. 1Virgin Instruments, Sudbury, MA, 2Vanderbilt University School of Medicine, Nashville, TN. brain bladder spine spinal cord Introduction Tissue imaging and profiling by MALDI-TOF MS provides unique information that facilitates our understanding of normal biological and pathological processes. This technology provides a high-throughput tool to interrogate protein expression in tissue at the molecular level. It can also provide direct measurements of distribution of drugs and metabolites in tissues and correlate these distributions with changes in the proteome. While many significant results have been reported over the past ten years, more widespread applications have been inhibited by limitations on the combined speed and spatial resolution available with existing instruments. In this work two new high-performance MALD-TOF instruments are evaluated for these applications. Method The new analyzers employ a 5 kHz laser for higher speed and better sample utilization. A linear MALDI-TOF mass spectrometers is used for imaging proteins. This analyzer operates at ion energy of 42 keV and includes a new hybrid detector that is immune to saturation effects without compromising time resolution. The second instrument is a reflector MS operating at 8 kV that provides very high resolving power and mass accuracy for peptides and small molecules. This instrument was used for imaging lipids in tissue samples using DHB matrix Sample Plates These instruments employ a sample plate 124x127 mm outside dimensions with 102x108 mm active area, allowing relative large samples such as whole body tissue sections from small mammals to be imaged with relatively high resolution. For this work adaptor plates accommodating up to 4 conductive 45x45 glass slides or 45x47 metal plates were used. An image of the plate is generated by a flat-bed scanner and that image is used to define the sample to be analyzed. 772.6 866.6 stain TIC 500-1000 772.6 50 mm resolution stained section for similar (but not identical) mouse brain section Example of mouse brain image generated with profile spectra. 250 shots per pixel, 1 mm/s raster at 50 mm spacing. 100,000 spectra in 1.4 hours 1 772, 800,845,881 2 High Speed Imaging of lipids in mouse brain sections. 2.5 mm/s, raster at 50 mm spacing, 50 shots/pixel (spectra transfer time 0.01 s) 50 pixels/s at 50 mm resolution 150,000 spectra in 50 minutes 3 4 Lipid images of whole mouse pup section at 50 mm resolution, 100 shots/pixel, 150,000 spectra in 1.3 hours. Note: Our mouse is backside down. protein Conclusions and Future Work This work has demonstrated that tissue images with 50 mm resolution can be generated with practical speeds for many applications using a laser operating at 5 kHz. There is no apparent loss in data quality relative to earlier work at 20-200 Hz. We have demonstrated that up to 1 million spectra can be generated, stored, and processed per day, but at present data interpretation may be significantly slower than data acquisition. The images and spectra presented here represent a very small part of the total information available in one of these measurements. Further improvements in software and matrix deposition will be required to fully utilize this capability. References 1. J. A. Hankin, R. M. Barkley, R. C. Murphy, “Sublimation as a Method of Matrix Application for Mass Spectrometric Imaging”, J. Am. Soc. Mass Spectrom. 2007, 18, 1646-1652. 2. P. Chaurand, J. L. Norris, D. S. Cornett, J. A. Mobley, and R. M. Caprioli, “New Developments in Profiling and Imaging of Proteins from Tissue Sections by MALDI Mass Spectrometry”, J. Proteome Res. 2006, 5, 2889-2900. Acknowledgements The assistance of Dr. Pierre Chaurand in providing the tissue sections with matrix deposition and the histological images of the sections. This work was supported in part by the National Institutes of Health under grants RR025705 and GM079833. Protein images of whole mouse pup at 5 kHz, 37 mJ/pulse. Raster at 50 mm spacing, 1 mm/s 500 shots/spectrum, 50x100 mm pixels, 75,000 spectra in 2.2 hours. The metal plate in the upper left position contains three mouse brain sections similar to those analyzed here, but all of the work presented was from samples on conductive glass plates. Whole mouse pup sections labeled 1-4 were analyzed for lipids using sublimed DHB matrix as described earlier.1 This image was generated after analysis and most of the matrix has been desorbed. All 4 of these sections were analyzed in one day and generated 1,000,000 mass spectra. Data from one of these (3) is presented here. All of the data presented on protein imaging from whole mouse pup was generated from the sample on a glass slide at lower right. Matrix was spotted with sinipinic acid at 200 mm intervals using the automatic spotter described previously.2 Imaging of lipids and other small molecules using high-resolution Reflector TOF employs “on-the-fly” peak detection and calibration. Spectra are only saved if they meet predetermined criteria; typically a minimum intensity within a selected mass range. This has no effect on maximum acquisition rate (limited only by transfer time from digitizer to computer--typically <10 ms) but dramatically reduces storage requirements and accelerates data reduction and interpretation. Protein imaging with the linear TOF typically employs full profile spectra with 4 ns bins 20,000 RP note doublets 200 mm Expanded view of 1x1.5 mm portion of TIC for whole mouse image. Sinipinic acid matrix was spotted at 200 mm intervals and sample was scanned with 50x100 mm pixels. Results indicate that matrix spots typically less than 150 mm in dia and resolution of scanning is 50 mm.