Download
1 / 1
10 likes | 111 Views
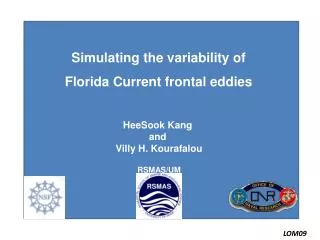
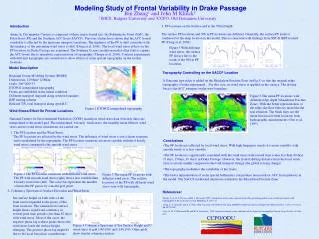
Coherency. Coherency. Phase. Phase. Period (Day). Period (Day). Conclusions. The PF location is affected by local wind stress. With high frequency winds, it is more variable; with smooth winds, it is less variable.

E N D
Coherency Coherency Phase Phase Period (Day) Period (Day) Conclusions • The PF location is affected by local wind stress. With high frequency winds, it is more variable; with smooth winds, it is less variable. • The PF location is significantly correlated with the wind stress with several time scales less than 40 days (8 days, 15days, 30 days) in Drake Passage. However, the frontal shifting distance from the local wind stress is much smaller compared to the total transport change (the global forcing change). • The topography modulates the variability of the fronts. • The better representation of some special bathymetry can produce more realistic ACC front pathway in the model. The SACCF northward intrusion is related to the Shackleton Fracture Zone. Period (Day) Period (Day) CCPO/ODU Modeling Study of Frontal Variability in Drake Passage Bin Zhang1 and John M Klinck2 1IMCS, Rutgers University and 2CCPO, Old Dominion University Introduction Antarctic Circumpolar Current is composed of three major frontal jets: the Subantarctic Front (SAF), the Polar Front (PF) and the Southern ACC front (SACCF). Previous studies have shown that the ACC frontal variability is affected by the upstream transport variations. The tendency of the PF to shift coincides with the tendency of the maximum wind stress to shift (Dong et al. 2006). The local wind stress effects on the PF locations in Drake Passage are examined. The Southern Ocean circulation model often fails to capture the ACC fronts due to unrealistic representation of topography (Thorpe et al. 2004). Contrast experiments with different topography are carried out to show effects of some special topography on the frontal locations. 3. PF locations on the Surface and at the 500m Depth The surface PF locations and 500 m PF locations are different. Generally, the surface PF tends to southward of the deep location in the model. This is consistent with findings from SST & XBT tracked PF (Dong et al. 2006). Figure 5 With different wind stress, the surface PF always lies to the south of the 500 m PF locations. Model Description Regional Ocean Modeling System (ROMS) Dimensions: 1200km*1200km Grids: 200*200*33 ETOPO2 interpolated topography Fronts are embedded in the initial condition Different transport imposed along western boundary KPP mixing scheme Relaxed T/S, total transport along open B.C. Topography Controlling on the SACCF Location A Gaussian type ridge is added on the Shackelton Fracture Zone (in Fig.5) so that the original ridge topography is better represented. For this case, no wind stress is applied on the surface. The driving force is the ACC transport on the west boundary. Figure 6 The mean PF locations with different ridge depth (Shackleton Fracture Zone). With the better representation of the ridge, the flow behaves more like the real situation. The black lines are the mean historical frontal locations from hydrographic measurements (Orsi et al, 1995). SAF Figure 1 ETOPO2 interpolated topography PF Wind Stress Effect On Frontal Locations National Centers for Environmental Prediction (NCEP) reanalysis wind stress data (6 hourly data) are interpolated to the model grid. The interpolated 6 hourly wind stress, the monthly mean filtered wind stress and no wind stress simulations are carried out. SACCF • The PF Location and the Wind Stress • The PF locations are affected by the wind stress. The influence of wind stress is not a linear response and is modulated by the topography. The PF location variations are more variable with the 6 hourly wind stress compared to the smooth wind stress. Figure 2 The PF location variations with different wind stress. The PF with smooth wind stress(right) shows less variable than 6 hourly wind stress(left). The color bar represents the number of times the PF passes by a model grid point. Figure 3 The mean PF locations with different wind stress. The relative locations of the PF with different wind stress vary with topography. • Coherency Spectrum of Surface Elevation and Wind Stress References: Sea surface height on both sides of the front can be regarded as the proxy of the front locations. The simulated sea surface height shows significant coherency in several peak time periods (less than 40 days) with wind stress. Most of the cases, the negative phase lag at these peaks shows the wind stress leads the surface height changing. The positive phase lag might be due to the local baroclinic contributions. • Thorpe, S. E., D. P. Stevens and K. J. Heywood, 2005: Comparison of two time-variant forced eddy-permitting global ocean circulation models with hydrography of the Scotia Sea. Ocean Modelling, 9, 105-131. • Dong, S., J. Sprintall, and S. T. Gille, 2006. Location of the Polar Front from AMSR-E Satellite Sea Surface Temperature Measurements, J. Phys. Oceanogr., 36, 2075-2089. • Orsi, A. H., T. Whitworth III, and W. D. Nowlin Jr., 1995: On the meridional extent and fronts of the Antarctic Circumpolar Current. Deep-Sea Res.,42, 641–673.. Figure 4 Coherency Spectrum of Sea Surface Height and U wind stress at grid (140,100) and (140,150). Other grids show similar coherency patters.