Download

1 / 36
370 likes | 701 Views
Introduction to SAS. What is a data set?. A data set (or dataset) is a collection of data, usually presented in tabular form. Each column represents a particular variable. Each row corresponds to a given member of the data set in question. . There are three types of datasets. Cross-sectional

E N D
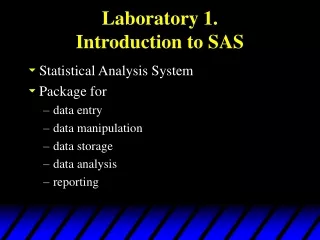
What is a data set? • A data set (or dataset) is a collection of data, usually presented in tabular form. Each column represents a particular variable. Each row corresponds to a given member of the data set in question.
There are three types of datasets • Cross-sectional • Time-Series • Panel (combination of cross-sectional time-series data sets)
Cross-Sectional Data • Cross-sectional data refers to data collected by observing many subjects (such as individuals, firms or countries/regions) at the same point of time, or without regard to differences in time.
Time-Series Data • A time series is a sequence of data points, measured typically at successive times spaced at uniform time intervals. • Frequencies: daily, weekly, monthly, quarterly, annual
Panel Data • Panel data, also called longitudinal data or cross-sectional time series data, are data where multiple cases (people, firms, countries etc) were observed at two or more time periods.
What should you know about your dataset? • What type of dataset do you have? • How many variables do you have? • How many observations do you have? • What kind of variables do you have? • Numeric. numerical variable is an observed response that is a numerical value • String. A string variable is any combination of one or more characters. • Are there missing values?
How to store your dataset? • Microsoft Excel Spreadsheets
1. What does SAS look like? EXECUTE THE PROGRAM LOG WINDOW NEW LIBRARIES EXPLORER WINDOW OUTPUT WINDOW EDITOR WINDOW RESULTS WINDOW
Anatomy of a SAS Program • Data name statement • Input statement (list of all variables to be read into the program) • Transformation statements • Datalines statement (copy & paste from Excel) • Placement of data • PROC statements • Means • Corr • Reg • Model • Autoreg (7) Run Statement
Spaghetti Sauce Program Data set name Input statement Placement of data after the datalines statement
Need this statement after the data No date will appear on the output
Creation of a data set named datareg which contains the predicted values of the dependent variable and the residuals Model Statement Test of normality of the residuals autoreg also produces AIC, SIC, and within sample MAE, MAPE, and RMSE. print Confidence intervals associated with the estimated coefficients Square of partial correlation coefficients
Statistics in SAS Use PROC MEANS or PROC CORR Proc Means Data = ??? N mean median std min max cvskewness kurtosis var var_name1 var_name2…;
Regression in SAS Use PROC REG PROC AUTOREG or PROC MODEL Simple and Multiple Regression
Using SAS PROC REG for Simple Linear Regression • The general syntax for PROC REG is • PROC REG <options>; <statements>; • The most commonly used options are: • DATA=datsetname • Specifies dataset • SIMPLE • Displays descriptive statistics • The most commonly used statements are: • MODEL dependentvar = independentvar </ options >; • Specifies the variable to be predicted (dependentvar) and the variable that is the predictor (independentvar) • Several MODEL options are available.
Example Proc reg data = spaghettisauce; Model qprego = pprego/ P r cliclb dwprob;
SSR SSE SST R2
Confidence limits of parameter estimates square of partial correlation coefficients
Using SAS PROC REG for Multiple Linear Regression • The general syntax for PROC REG is • PROC REG <options>; <statements>; • The most commonly used options are: • DATA=datsetname • Specifies dataset • SIMPLE • Displays descriptive statistics • The most commonly used statements are: • MODEL dependentvar = independentvar </ options > • Specifies the variable to be predicted (dependentvar) and the variables that are the predictors (independentvars)
MODEL STATEMENT OPTIONS • (Place after slash following the list of explanatory variables.) • PRequests a table containing predicted values from the model • R Requests that the residuals be analyzed. • CLI Requests the 95 percent upper and lower confidence limits for an individual value of the dependent variable.
SSR SSE SST R2 Square of partial correlation coefficients