Download

1 / 29
300 likes | 341 Views
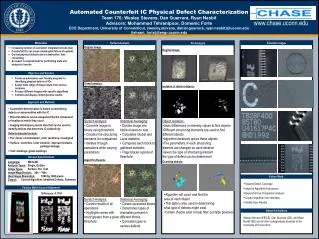
Detect non-genuine IC's using physical methods, SEM imaging, material analysis, and image processing to prevent counterfeit market infiltration.

E N D
IC Counterfeit Detection Using Physical Inspection Methods Group 173 Project Members: Kevin King (Electrical Engineering) David M. Orosz (Electrical Engineering) Christopher Smedberg (Computer Engineering) Project Advisors: Mohammad Tehranipoor (Dept. of Electrical and Computer Engineering) Omer Khan (Dept. of Electrical and Computer Engineering)
Project Statement: The counterfeit integrated circuit market is a major problem that can ruin company's reputations and lead to faulty products. The most common type of counterfeits are recycled IC's or IC's that have already been used but are sold as new. These used IC's may no longer function within specifications, or may not function properly. We will take advantage of the fact that a recycled IC will almost always show some physical differences in its packaging to detect non-genuine IC's
Key Concepts: • IC Counterfeiting • Blacktopping • Remarking • Re-Tinning • Scanning Electron Microscopy • High Magnification Imagery • Material Analysis • Image Processing • Fingerprinting • Image Comparison
IC Counterfeiting • BlackTopping - Resurfacing technique used to remove signs of aging • Remarking - Include blacktopping, but will be used to change type or quality of chip. Changes markings on chip • Re-Tinning - During IC recycling, damage to the pins will most likely occur. Re-tinning attempts to restore the pins to new quality
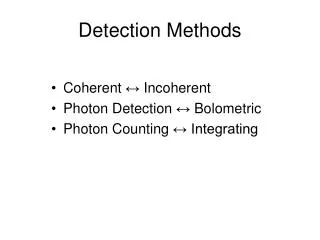
Electron Microscopy Scanning Electron Microscopes use a beam of electrons to scan the surface of an object. The interaction of the electrons with the electrons in the object being imaged, give data about topography and composition We will use the SEM to gather highly detailed images of the IC's surface, and material analysis information of the chips capping material and pin material
Image Processing The analysis and manipulation of a digitized image Using images captured by the SEM, we will produce fingerprints of these images Image Genuine and Suspect Chips Generate fingerprints for all chips being tested Compare the fingerprints of suspect chips with the fingerprint of the genuine chip Genuine Counterfeit
Basic Visual Test: This test will not be automated and will use a human's best judgement Using no magnification or very low-power magnification, the chip should be inspected for blatant defects, such as scratches or bent pins The Lot Codes and Number of pins should be checked to make sure they match as they should
Marking Permanency Test Test 1 - Using a mixture of 1 part alcohol, and 3 parts mineral spirits, use a cotton swab to rub this mixture over the surface of the chip. A color change, removal of markings or color may indicate a counterfeit IC Test 2 - Using Acetone, repeat the test as above. Acetone may also make a noticeable difference to the texture of the surface of a counterfeit chip
High Magnification Texture Test Using a highly magnified image of the suspect chips texture, this image will be compared to a similar image of a known good chip. Using image processing techniques, these images will be compared and it will be determined whether the image raises any questions This test takes advantage of the fact that most blacktopping techniques will show a different texture than genuine chips
Surface Material Analysis The material analysis function of the SEM will also be used to find the chemical makeup of the chips surface. Blacktopping also uses a material different from what is used in the factories. The differences may be subtle, depending on the quality of the counterfeit, but can be observed when comparing the material analysis of the suspect chip to a known good chip
Pin Re-Tinning Test Using the material analysis ability of the SEM, the material of the pin will be tested During counterfeiting, pins will be restored using a re-tinning process Evidence of this process may be found when comparing the material analysis of a suspect chip to the material analysis of a known good chip
Tested Chip The chip that was tested was a Motorola microprocessor (MC6809CP) Motorola 6809 microprocessor family 8-bit CPU 64 KB RAM Up to 2Mhz on chip clock 40 pin plastic DIP packaging
Marking Permanency Tests Marking permanency tests hope to expose the existence of blacktopping • Apply solvent (Acetone, or 1 pt Alcohol, 3 pts Mineral Spirits) • Check applied area for color/texture changes • Check markings for fading/disappearance • Check surface for appearance of color/texture inconsistencies
Visual Inspection & Alcohol Test Results Visual Inspection: Genuine: 40 pins, no discoloration or wear Consistent color and texture Clean markings Counterfeit 1: 40 pins, slight wear and discoloration Consistent color and texture Clean markings Counterfeit 2: 40 pins, no wear or discoloration Consistent color and texture Clean Markings Alcohol Test: Genuine: No noticeable effect No color on cotton swab Counterfeit 1: No noticeable effect No color on cotton swab Counterfeit 2: No noticeable effect No color on cotton swab
Acetone Test Results Genuine: No effect No color on cotton swab Counterfeit 1: Inconsistent color/texture around chip markings Color transfer to cotton swab (fig 1.) Counterfeit 2: Inconsistent color/texture on cap Color transfer to cotton swab (fig 2.) Fig 1. Fig 2.
Outlier Detection Method • We developed a simple algorithm to detect outlier images in a given directory • Based on the fact that counterfeit chips have different textures than genuine chips (they are more blurry due to the sandblasting) • Inputs: Image directory and extension • Outputs: All images that are outliers • To make the detection easier, images are first converted to black-and-white via pixelwise threshold computation. • Find average grayscale value, and every pixel less than that value is converted to white. Everything else is converted to black. • This method was carried out in MATLAB.
Step 1: Reading and Adjustment • First, the images are read from the given directory. • Next, the images are converted from their original RGB style to grayscale. This allows the program to operate with a single number, as opposed to three separate ones. • Then, the gray images are adjusted (using MATLAB's imadjust function). This sharpens the images and makes each level of gray more clearly defined.
Step 2: Convert All Images to Binary • A threshold value is calculated by taking the average grayscale pixel value among all images • Any pixel with a grayscale value under that threshold is converted to white (255), all other pixels are converted to black (0). • The amount of whitespace is stored in a vector.
Step 3: Plot Gaussian Curve and Determine Outliers • The gaussian bell curve will show us which images are outliers. • If they are not within two standard deviations of the median, they are considered outliers. • By the three-sigma rule, 95% of values in a normally distributed set occur within 2 sigmas of the median.
Texture Analysis Results Images in directory (all are png) The top-left image 'g1' is the outlier.
Texture Analysis Results All images converted to binary
Texture Analysis Results MATLAB displays the Gaussian curve and lists all images that fall outside of the two-sigma lines.
Budget Available : $5,000 Estimate: $150 Purchased: • Dremel Tool $150 • Acetone, Alcohol, Mineral Spirits $30 Remaining Budget: $4,820