Download
1 / 37
370 likes | 384 Views
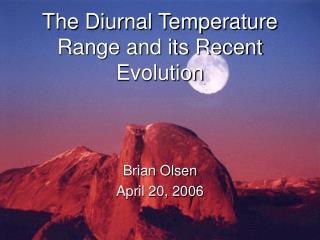
Explore recent temperature trends and climate change impacts, from the global scale to regional consequences. Learn about historical evidence, future projections, and proposed responses to mitigate the effects of global warming.

E N D
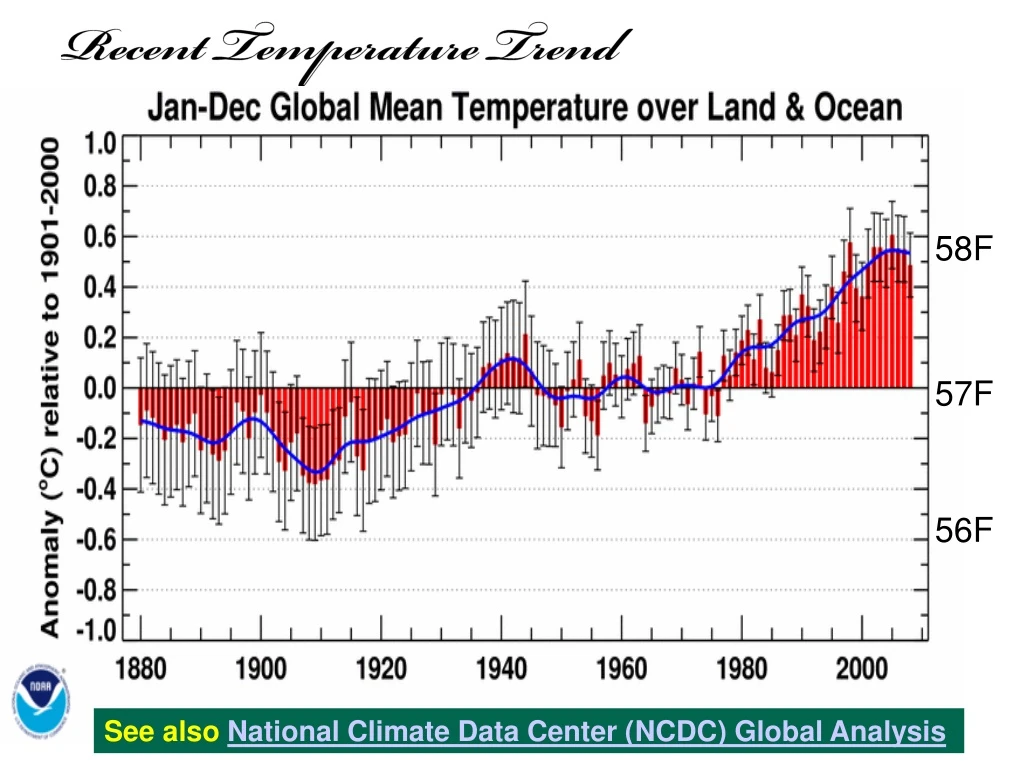
Recent Temperature Trend Globally averaged annual surface temperature 58F 57F 56F See also National Climate Data Center (NCDC) Global Analysis
Radiativeforcings The natural greenhouse effect = 151 W/m2 Anthropogenic enhancement = 1.6 +/- 0. 9 W/m2 IPCC2007 Intergovernmental Panel on Climate Change
Past evidence of CO2 and Earth’s climate? Since 1800 up 40% up 150% up 50%
Emissions that would account for observed atmospheric CO2 increase millions of tons of carbon In 2007, China surpassed U.S. as leading emitter of CO2
CO2 & Climate Use of fossil fuels as energy source
The Past See Fig 14.9
The Stefan-Boltzmann law relates radiant power density (W m-2) to temperature (K). The derivative yields the rate of change in radiant power density with a change in temperature. Sensitivity = d(σT4)/dT = 4 σ T3 = 4 (5.67x10⁻⁸ W m-2 K-4) (288 K)3 = 5.4 W m-2 K-1 i.e., temperature increases by 0.2°C (0.3°F) for a radiative forcing of 1 W m-2 But this is for a system in equilibrium
Linear Non-linear Abrupt shift of “climate states” B The real response (sensitivity) to forcings depends on system inertia and feedbacks
oF 9 6 3 0 predicted warming by 2100 AD (degrees C)
Climate Change Globally Averaged Trends Climate change trends Past 100 years Temperature: 1 degree F increase Sea Level: 4 to 10 inch rise Precipitation: 1% increase on land Next 100 years(Intergovernmental Panel on Climate Change) Temperature: 1.6 to 6.3 degrees F Sea Level: 6 to 39 inches Precipitation: increase "we don't know what the consequences are going to be" Chris Thomas, Univ of York quoted by E. Kolbert in “Fields Notes from a Catastrophe”, p. 90
Regional scale Thus far we focused on “Global” averages Forecasts of Climate Change on Regional and Local Scales are much more uncertain BUT THAT’S WHAT MATTERS
Observed Temperature Increase from 1880 to 2003 See also Fig 14.3
predicted warming by 2100 AD (degrees C) Fig 15.12
Fig. 9.14 3rd ed Observed trends 1900-2000
WINTER SUMMER Changes to clouds (cloudiness, precipitation) is greatest uncertainty Predicted by 2100
Miami Albany Los Angeles
Outcomes of two different climate models warmer and wetter warmer and drier
e.g. hydropower dams e.g. wind farms
Disruptions Disruptions of Climate Change Water Resources Water Supply Water Demand Recreation Irrigation Hydropower Water Quality Flood Control Navigation Agriculture Crop choice Crop yields Food distribution Human Health, Safety & Settlement Diseases/Illnesses Displaced Populations Unusual weather Air Quality Ecosystem Resources Forests Fisheries/Wildlife
Response? Response to Global Warming? Adaptation [“Deal” with it] Protect - build sea wall Retreat/abandon - move inland Accommodate - change practices to suit new conditions Venice Geo-engineering [“Treat” it] Cause an anthropogenic cooling to offset warming Augment removal of greenhouse gases (e.g. carbon dioxide) Mitigation [“Cure” it or at least slow it down] End (or reduce) anthropogenic GHG emissions
The CO2 Problem? 1. Don’t Worry
The CO2 Problem? 1. Don’t Worry i) won’t be a problem ii) just adapt to changes, if any iii) use geoengineering if problems develop
The CO2 Problem? 2. Increase Uptake (geoengineering) i) afforestation / reforestation ii) ocean biomass stimulation (fertilization) iii)filters
The CO2 Problem? • Don’t Worry (adaptation) (be happy) 2. Increase Uptake (geoengineering) 3. Reduce Emissions (mitigation)