Download
1 / 37
370 likes | 465 Views
This study assesses evaporative emissions from gasoline storage sites and service stations, exploring factors affecting evaporation and control methods. It discusses VOCs, emission sources, and legislation, providing insights into emission prevention and minimization techniques.

E N D
By: J.S. Razavizadeh Supervisor: Prof. H.S. Ghaziaskar Tuesday 88.02.22 , 11.00 am An Evaluation of Evaporative Emissions ofGasoline from Storage Sites and Service Stations
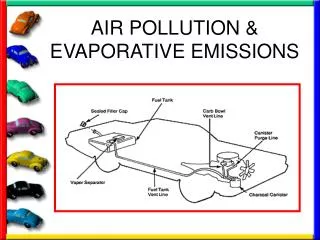
Displacement emissions 1- Introduction Breathing and withdrawal emissions 2- Evaporative emissions Filling emissions Emission from vehicle refueling Emissions prevention and minimization 3- Factors affecting evaporation Collection of vapor absorption 4-control of emissions Vapor recovery Pressure swing and purge regeneration Condensation Diffusion technologies Treatment of vapor 5-Legislation regarding evaporative emissions
The hydrocarbons emitted during petrol storage and distribution • can be broadly classified as volatile organic compounds (VOCs) 1-Pure hydrocarbons 2-Partially oxidized hydrocarbons VOCs 3-Organics containing chlorine , sulphur and nitrogen 1-Industrial and domestic solvents(40%) 1-Industrial and domestic solvents(40%) 2-exhaust gases from motor vehicles(25%) 2-exhaust gases from motor vehicles(25%) 3-Evaporation and loses from motor vehicle(10%) 4-Petrol distribution(3%) VOCs emissions originate from 5-Vehicle refueling(2%) 6-Oil refining (3%) 7- from other source(17%)
Oxygen Molecule (O2) + NOx + VOC + Sunlight Ozone Molecule (O3)
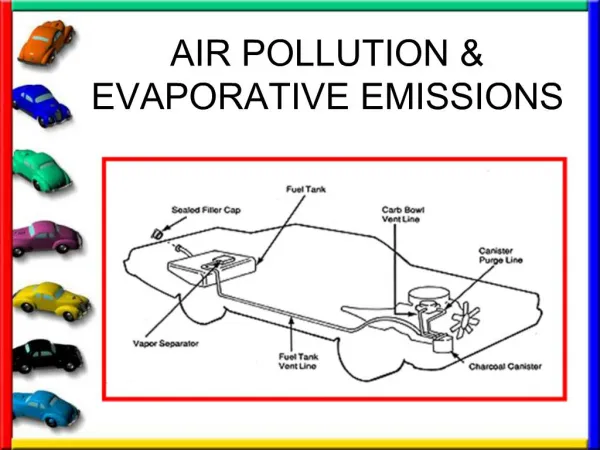
EVAPORATIVE EMISSIONS the average emission from a typical European petrol storage and distribution system, is O.56% volume of the petrol distributed displacement refueling breathing and withdrawal filling 0.3 0.03 0.05 0.18
Displacement emissions • Displacement emissions occur from fixed roof storage facilities (bulk storage tanks), as well as underground service station tanks due to vapor displacement by incoming petrol. • Displacement emissions from fixed roof storage facilities account for 0,14 % • from service station storage tanks for 0,16 % Breathing and withdrawal emissions • Breathing emissions are caused by variations in tank contents, temperature and by changes in barometric pressures that cause expansion and contraction of the liquid and vapor in a tank. • Withdrawal emissions occur when petrol is pumped out of a storage tank resulting in the intake of air through pressure/vacuum relief valves or vents • Breathing and withdrawal emissions from bulk storage tanks account for 0,02% and from service station storage tanks for 0,01% of total emission losses.
Filling emissions • Filling emissions occur when petrol is transferred from storage tanks to road tankers. • two types of vapor making up filling emissions, namely preloading vapor (PLV) and evolution vapor (Ve). • PLV is residual vapor originating from a tank's previous contents, being displaced by loading of the new product, and is defined as a fraction or percentage of full saturation, Cp,. • Cp less than 1 % (Cp< 0,Ol) when the previous contents of a road tanker were a non-volatile product. • Cp between 10% and 20% (0,l <Cp < 0,2) when the previous contents of a tanker were discharged completely at one point. • Cpbetween 30% and 50% (0,3 < Cp < 0,5) when the previous contents were discharged at several occasions. • Cp between 90% and 100% (0,9 <Cp < 1,O) when the contents of a tanker were discharged at a service station tank that allows for vapor return.
Evolution vapour (ve) evaporates from the product itself when it is being loaded. Petrol can be loaded into a road tanker via top splash loading, submerged top loading or bottom loading. • In order to estimate Ve a parameter VB is used to represent the amount of splashing in a tanker during filling. • VB is equal to the fraction of the original tank atmosphere that is assumed to be completely saturated during loading. • VB = 0,4 for top splash loading. • VB = 0,15 for submerged top loading. • VB = 0,13 for bottom loading. Concentration of petrol vapor under equilibrium conditions Parameter representing the amount of splashing filling emission liquid to vapor volume equivalence factor Average preloading vapor concentration
Emissions from vehicle refueling • These emissions contribute to 0,18 volume % of the total emissions from petrol storage and distribution systems 1- product (liquid petrol) properties. FACTORS AFFECTING EVAPORATION 2- Liquid/vapor interface areas. 3- turbulence in the relevant liquid and vapor.
Control of emission • Safe operation • Ease of operation • Reliable operation • Low maintenance • Low operation costs • Low investment costs • Highest possible emission reduction. Emissions prevention and minimization Collection of vapor absorption 4-control of emissions Vapor recovery Pressure swing and purge regeneration Condensation Diffusion technologies Treatment of vapor
Emission prevention and minimisatim • decreasing the volatility of petrol • vapor balancing • minimizing the liquid/vapour interface area • reducing turbulence.
Vapour recovery Step 1 collection ofVOCs/air mixture Step 2 separation of VOCs from air Step 3 the recovery of the separated VOCs into liquid state.
Once the vapor has been collected, various processes or combinations ofprocesses can be used to separate and recover the vapor. These include condensation, absorption, diffusion and adsorption. Condensation: by compression or cooling Condensation is most efficient for VOC recovery at relatively high VOC concentration (above 5000 ppm) Air Step2 and 3 Separation and Recovery via condensation Step1 collection VOC/air mixture Condensed VOCs Flow diagram for condensation as vapor recovery process.
Absorption : absorbed in to liquid due to molecular force. depends of vapor pressure and the temperature of the absorbent. Low boiling point hydrocarbon liquid( like crude oil or kerosene) are often used for VOC separation from air via absorption. air Step2 Separation from Air via absorption (with kerosene) Step1 collection Absorbent (kerosene)/ VOC mixture VOC /air mixture Recycling of Absorbent (kerosene) Separation from Absorbent via distillation Step3 Recovery via Absorption (with petrol) Absorbent (petrol)/VOC mixture VOC
Absorption can be used for high vapor flows and VOC concentration ranging between 500 ppm to 5000 ppm. Advantage and disadvantage of absorption
air Diffusion technologies: such as membrane is relatively new Two types of membrane namely diffusion membrane and solubility membrane. Step2 Separation via diffusion Step1 collection VOC /air mixture Step3 Recovery via absorption Step3 Recovery via condensation VOC /absorbent mixture Condensed VOCs
Adsorption: mosteffective methods and most economical. the adsorption medium most generally used is activated carbon and hydrophobic zeolites. two regeneration technologies are currently in use, namely: thermal regeneration and pressure swing and purge regeneration. air Step2 Separation via adsorption Step1 collection VOC /air mixture Step3 Recovery via absorption Step3 Recovery via condensation Condensed VOCs VOC /absorbent mixture
References: • MEMBRANES FOR VAPOR/GAS SEPARATION Richard W. Baker Membrane Technology and Research, Inc. 1360 Willow Road, Suite 103, Menlo Park, CA 94025 • NEW TECHNOLOGY FOR EMISSION REDUCTION AT PETROL STATIONS OHLROGGE K., WIND J. GKSS-Forschungszentrum Geesthacht GmbH, Institut für Chemie, Max-Planck-Strasse, D-21502 Geesthacht, Germany • Safety design of a petrol pump attendant robotFrancesco Becchi, Rezia M. Molfino and Roberto P. Razzoli University of Genova, Genova, Italy • The Problem of Volatile Organic Compound (VOC) Emissionsfrom Petrol in Lithuania and Methodological Aspects of Emission Reduction Viktoras Doroševas, Vitalijus Volkovas, Ramūnas GulbinasTechnological Systems Diagostics Institute, Kaunas University of Technology • Membrane Based Vapor Recovery at Petrol Stations Klaus Ohlrogge and Jan Wind • A policy instrument for the reduction of greenhouse gas emissionsAn Interim Report to the Tyndall Centre for Climate Change Research7th |January 2004 Dr Kevin Anderson, Tyndall North, UMIST Kevin.anderson@umist.ac.uk Tel. 0161 200 3715 Dr Richard Starkey, Tyndall North, UMIST