Download

1 / 10
100 likes | 237 Views
VCE IT – UNIT 2. Sources of authentic data. Term 2 – Week 9. Sources of authentic data. Primary data Secondary data ABS census quality statement – outlines four principal sources of error:

E N D
VCE IT – UNIT 2 Sources of authentic data Term 2 – Week 9
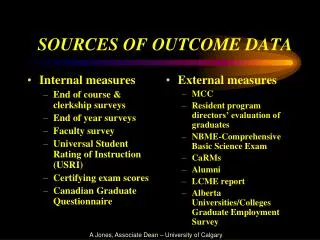
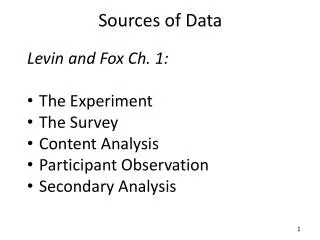
Sources of authentic data • Primary data • Secondary data • ABS census quality statement – outlines four principal sources of error: • Respondent error: the person filling out the form misunderstands a question and provides incorrect information. • Processing error: when the technique to input data makes a mistake (can be via manual or automatic entry). • Partial response: when the person only fills out part of the survey. • Undercount: when not all respondents complete the survey.
Some sources of authentic data include: • The World Bank www.worldbank.org • Organisation for Economic Cooperation and Development (OECD) www.oecd.org • CIA World Factbookhttps://www.cia.gov/library/publications/the-world-factbook • Australian Tax Office www.ato.gov.au
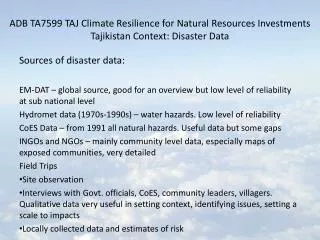
Data sources and methods of acquisition • We need to start with raw facts before we can produce information. • Primary: Data obtained through measurement. Can include surveys, interviews, direct observation etc. Best to have a quality process in place to avoid errors. • Secondary: Data obtained from someone else or published work. Includes books, websites, newspapers etc. • •When acquiring data, you need to be mindful of what to expect and what form the data might come in (i.e. handwritten surveys).
Data integrity • Data entered must have integrity (degree to which it is correct) for useful information to be presented. The more errors in data, the lower the integrity. This includes misspelled words. Users will not rely on this data. • Why is it important? • To ensure integrity of data, we need to validate it as it’s entered into the database. E.g. When purchasing something online, you will be prompted for the three-digit security code on the back of the card.
Measurement • The most common technique used for gathering data. • Examples include retail stocktake, ascertaining the numbers in a crowd by counting admission tickets etc. Can also be electronic e.g. scanning a barcode, temperature-activated heating, hits on a website etc.
Data types and structures relevant to selected software tools • Many different software tools can be used to create data visualisations; however, they are often derived from spreadsheet or database tools. • Data can be entered into ‘Many eyes’ website http://manyeyes.alphaworks.ibm.com/manyeyes • Data needs to be separated into distinct fields or columns that have only one sort of data type in them.
Questions • What is a data visualisation and why are the a preferred method of information presentation? • Explain the three processes that the analysis stage involves. What is the benefit of determining this information? • Give a situation when quantitative data would be preferred over qualitative data, and vice versa. • What are the four main ways data visualisation is used for? • What type of data visualisation would you use: • To show the price increase of petrol over the last 5 years? • To show how much more money women spend of shoes than men? • To show a classes distribution of exam marks?
Give an example of when you would use a histogram, line chart and bubble chart. • Describe the errors that can occur when acquiring data. • Why would it be important to identify if a data set had an undercount? • What is the difference between primary and secondary source data? • Why is it important to ensure data presented has integrity?