Download
1 / 21
210 likes | 315 Views
Dive into the intricate world of ant diversity, predicting climate change effects, impacts of urbanization, and missing data gaps. Learn about spider ants, phenology, and the role of climate in shaping ant populations.

E N D
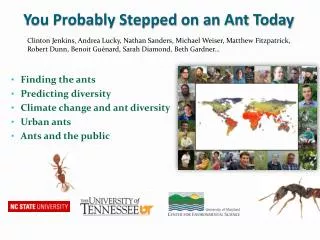
You Probably Stepped on an Ant Today Clinton Jenkins, Andrea Lucky, Nathan Sanders, Michael Weiser, Matthew Fitzpatrick, Robert Dunn, Benoit Guénard, Sarah Diamond, Beth Gardner… • Finding the ants • Predicting diversity • Climate change and ant diversity • Urban ants • Ants and the public
Ant Diversity in Light of Climate Change Jenkins et al. (2011) Diversity and Distributions • Generalized Linear Model • Climate: temperature, precipitation, aridity • Geography: biogeographic region • Interactions: region * climate
Gaps in our Knowledge Lots of ant data Not so many data No-analogue climates & new biomes Precipitation Lots of ant data Temperature No-analogue climates
Findings • Ant diversity generally increases with temperature • At the highest temperatures diversity is also the most variable, ranging from 1 to 145 species • Future climates will be more like these hot places, which are also where we know the least
New directions • Individual species modeling • Urbanization and phenology • Missing ant diversity • School of Ants
Spider Ants(Leptomyrmex spp.) • Name is appropriate • SE Asia / Australia • Wingless queens = limited dispersal • Maxent models + others(?) • Climate works well • Other remotely sensed variables • ID environmental variables separating species L. darlingtoni Localities
Spider Ants Covariates L. fragilis
Suitability for L. erythrocephalus Maxlike MaxEnt Climate + remote sensing Climate + remote sensing Climate Climate
Summary of spider ants • Species distribution models work • Climate explains most of it • Remotely sensed variables help resolve finer scale
SE Climate Science Center / Global Change ForumUrban Warming & Phenology Working Group
Working group questions • How are phenologies of organisms altered by living in urban environments? • Can we apply these findings to understand responses of organisms to climate warming? • Identify available datasets to address this question (VIP Explorer)
Cities as windows into climate change • Urban heat islands: “a metropolitan area which is significantly warmer than its surrounding rural areas” • Mimic future warming • Comparisons with adjacent rural areas provide useful controls
Phenologicalmetrics • Date of first appearance • Date of last appearance • Duration of activity period • Peak activity period • Change in phenology over time (longitudinal) • Current phenology (space for time)
Flight phenology of UK butterflies: Date of first appearance
How does phenology vary as a function of urbanization? • Urbanization metric • Heat island model • % impermeable surface • Climate stations • Others?
Generic diversity of ants http://www.antmacroecology.org/ant_genera/index.html
Mapping approaches to mapping diversity Range maps Global Amphibian Assessment Model species diversity Kreft & Jetz 2007. PNAS
Missing diversity Model of generic diversity based on better sampled regions Predicted by the expert model Predicted by the environmental model Predicted by both models
>10,000 requests to participate • 500 sampling kits returned • 1,000s of ants to identify. Tiny myrmecologists on YouTube. http://www.youtube.com/watch?v=gMg55LTJ6gQ
Stuff we’d love from NASA • Update WorldClim • Global, multi-temporal dataset of NDVI, EVI, etc. • Global impervious surface • Time series of surface water