Download
1 / 34
340 likes | 442 Views
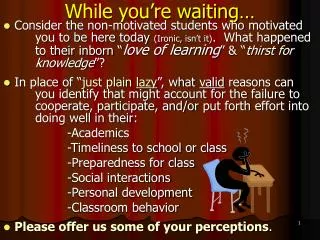
Engaging with the Reading While Waiting to Start. On the walls are 3 charts: “This was new to me” “I knew this, but had forgotten about it” “I know this well”

E N D
Engaging with the Reading While Waiting to Start • On the walls are 3 charts: • “This was new to me” • “I knew this, but had forgotten about it” • “I know this well” • Move from one to the other sheets, writing briefly 1-3 items which reflect your experience with the article that was emailed to you. (Copies are available if you didn’t print it out.) • If someone has posted a statement you agree with, put a hash mark in the “ME TOO” column.
DEVELOPING POWERFUL MEASURERS MICHIGAN’S PROFESSIONAL DEVELOPMENT IN THE TEACHING & LEARNING OF SPATIAL MEASUREMENT GVSU Regional Math & Science Center March 1, 2013
Introduction to STEM:Strengthening Tomorrow’s Education in Measurement • STEM is a research and development project based at Michigan State University that aims to address and make progress to solve the problem of teaching and learning spatial measurement in grades K-8. • Dr. Jack Smith of MSU and many graduate assistants have been studying this for over 6 years. • Since 2006, STEM has been working with NSF support (two cycles of multi-year funding) to determine the causes of the measurement problem. • Though it is likely that many factors are responsible for the problem we face, the project has mainly focused on the content of current elementary written curricula—what these materials include about measurement and what they don’t.
Workshop Overview • Our goals • Teachers and students understand measurement • Build common understanding of the challenges • Take what we learn and use it by: • Teach a lesson from this professional learning experience • Examine and modify an existing lesson and teach it! • Our professional learning approach for this project • This is not prescriptive (“do this” or "make it take it") workshop • Learning is (in part) a process of social negotiation • We have things to teach you; you have things to teach us
Overview A good deal of evidence shows that most of what our students are learning about measurement consists of procedures that many don’t understand very well. So when tasks are simple and routine, most can perform pretty well. But when they are asked to explain or apply their knowledge, when assessment tasks are not simple and routine, and when the situation contains more than one quantity in it (e.g., perimeter and area), they often perform poorly, generating faulty answers and explanations. This evidence arises both nationally (the NAEP) and statewide (the MEAP). We can do better, and if we do, the rewards for our students are substantial because of the importance of measurement for mathematical and scientific work and activity. Measurement is important for both college-bound and work-bound students; it is both practical and theoretical; and it motivates and connects to a wide range of other strands and topic areas in elementary mathematics.
Making the case • The national view (National Assessment Ed Progress) • The lowest performing content area (Preston &Thompson) • The content area with the greatest gap between white & minority students • Poor performance at all three grade levels tested • Performance gets progressively worse with added dimensions • length, area, volume • The international view • UK, Greece, Turkey, Asian countries struggle too
Possible Contributing Factors ‘ • State Standards & Assessments Limitations of Written Curricula Time & Timing of Instruction presentation in text content The Problem of Learning Spatial Measurement Static Representations Teachers’ Understandings Focus of instruction student challenges essential content • Discourse Challenges “procedural” “calculational” ambiguous reference (2D, 3D) ambiguous terms
STEM – Curriculum Analysis The three carefully chosen curricula are: • Scott Foresman-Addison Wesley Mathematics • UCSMP’s Everyday Mathematics • Saxon Math
STEM – Project Analysis In their analysis the MSU team looked at every lesson, problem, and activity of teaching curricula for two important aspects: • Knowledge elements - Spatial measurement knowledge (conceptual, procedural, conventional) [What content is in the textbook] • Textual elements - The ways in which this knowledge is expressed (statements, demonstrations, worked examples, questions, problems, games) [How the content is presented in the textbook]
Highlighting Major Findings • All three curricula are heavily procedural (more than 75% of all codes, all curricula) • Students do not have direct access to conceptual statements • Conceptual ideas, including definitions, are often presented after students are asked to use the procedures that depend on them. • There are significant gaps in the content of most materials.
Exploring the problem • Concretely, what we will be doing? • Exploring & examining measurement together • Discussing and making sense together • Thinking at multiple levels: • Here in this room • Your work as a teacher • Your work with students
What to Measure? The Puddle Problem
Broken Ruler Problem • NAEP released item, data available over many years (grades 4 & 8)
Broken Ruler Problem • What percent of students do you think answered this correctly? • What possible solutions might you expect to see from students?
Broken Ruler Problem • What percent of students do you think answered this correctly? • What possible solutions might you expect to see from students?
Broken Ruler Problem • What percent of students do you think answered this correctly? • What possible solutions might you expect to see from students?
Broken Ruler Problem • What percent of students do you think answered this correctly? • What possible solutions might you expect to see from students?
Broken Ruler Problem • What percent of students do you think answered this correctly? • What possible solutions might you expect to see from students?
The Problem (CONT.) • Reveals a lot about what is happening and not happening in classrooms • Reflection: This item violates “standard procedures” • Illustrates a useful general assessment strategy • Robust understandings can work around “violations” and locate errors • Shallow understandings stumble
Continuing with Area • There is no directly parallel item for area • Many area items are not well-documented, e.g., general description only • When multiple steps are involved, performance is poor • Look at one “irregular” figure item
More problems to consider • Shift to volume • Examine a simple item • Same game as before; surprises? • “Reading” the incorrect responses => student thinking
Volume example • What were the designers of the item thinking when they selected these choices? • What sort of thinking does each choice “attract”? • A NAEP Volume Item • source: 7th Mathematics Assessment, 1996 • Format: multiple choice ~ Population: Grade 4
Volume (cont.) Results • What do these results reveal? • Are the frequencies surprising?
Misleading Data • What happens when turn to the statewide view? • MEAP data look pretty good in Grades 3 and 4, but the data is misleading • All “measure with a ruler” items present objects aligned in standard position (at zero) • Problems start to show up with perimeter items and area items in Grade 5 • Spatial measurement items - poor performance selection
Math Curriculum Research Results • Gaps and overlaps (for length and area) OK for some • Space-filling units don’t need to be identical • When space is structured (dots, grids, rulers), students count locations rather than spatial units • For simple 2-D figures, perimeter and area get confused • Seeing the row by column structure of rectangular arrays is hard for some • Multiplication of lengths remains mysterious
Your Views • What shows up as problematic in measurement in your school, on the MEAP or in other ways?
In Sum (the issue) • Routine problems often produce decent (NAEP & MEAP) performance • Performance degrades when adding dimensions (Length, Area, Volume) • Non-routine, multi-step, & multi-measure problems are hard across grades/ages and measures • “Violation” items show weak understanding; faulty foundation under standard procedures • Research suggests that educators cannot take basic conceptual principles for granted; not obvious to all kids
Transitions to Tasks • Belief #1: We will learn more together about the conceptual core of measurement from working on & examining measurement tasks than by reviewing conceptual knowledge • Belief #2: Any task we work on is a candidate component of your work (teaching, sharing with colleagues, etc...)
Engaging with the Reading • On the walls are 3 charts: • “This was new to me” • “I knew this, but had forgotten about it” • “I know this well” • Move from one to the other sheets, writing briefly 1-3 items which reflect your experience with the article that was emailed to you. (Copies are available.) • If someone has posted a statement you agree with, put a hash mark in the “ME TOO” column.