Time Trends Analysis: Linear Models and Prediction Intervals in Population and Economic Data
Explore the effectiveness of linear trend analysis in National and World Population data sets. Predict U.S. Population, analyze residuals, and consider better models. Apply linear regression to non-linear trends in economic examples.

Time Trends Analysis: Linear Models and Prediction Intervals in Population and Economic Data
E N D
Presentation Transcript
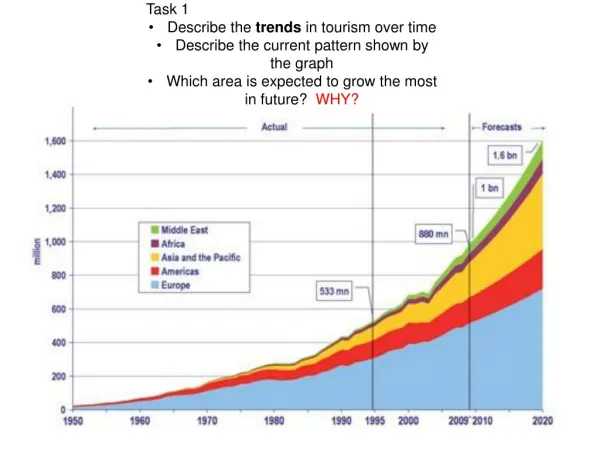
Time Trends Simplest time trend is a linear trend Examine National Population data set. How well does a linear model work? Did you examine the residuals plots?
Time Trends Examine National Population data set. Make a prediction of U.S. Population in year 2011. Comment on your prediction.
Time Trends Recall: Difference between the 95% CI and the 95% PI Confidence interval of the prediction: Represents a range that the mean response is likely to fall given specified settings of the predictors. Prediction Interval: Represents a range that a single new observation is likely to fall given specified settings of the predictors.
Time Trends Simplest time trend is a linear trend Examine World Population data set. Notice there is not data for each year! How can you make an appropriate time series plot? How well does a linear model work? Did you examine the residuals plots?
Time Trends Examine World Population data set. Is there a model that might work better than a linear model? How can you use linear regression with a non-linear model?
Time Trends Using Time Series Trend Analysis in Minitab Examine the U.S. population data set again.
Time Trends – Economics Example Open HSEINV data set invpc is real per capita housing investment in thousands of dollars price is housing price index Do invpcand price exhibit linear trends through time? Are invpc and price linearly related to each other?
Time Trends – Economics Example Book author fits this constant elasticity model: What do you think of this model? How is invpc affected by price?
Time Trends – Economics Example Author goes on to argue that both invpcand price have upward time trends and the model we just fit does not account for this. Now, fit this model:
Time Trends – Economics Example A your conclusions regarding How invpcis affected by price different for the two models?
Time Trends – Economics Example A your conclusions regarding How invpcis affected by price different for the two models? From the second analysis, real per capita housing investments are not influenced at all by price once time is accounted for.
Time Trends – Economics Example A your conclusions regarding How invpcis affected by price different for the two models? The first analysis showed a spruious relationship between invpc and price due to the fact that both variables are trending upward over time.
Time Trends – Fertility Rate Example Again! We fit this model: It was a decent model.
Time Trends – Fertility Rate Example Again! Now, fit this model: Comment…
Time Trends – Fertility Rate Example Again! But wait, gfr does not follow a strictly linear trend through time:
Time Trends – Fertility Rate Example Again! Why not just add a squared time term to the model too. This is now a quadratic model in time: Comment…
Time Trends – Fertility Rate Example Again! But wait, gfr does not follow a quadratic trend through time:
Time Trends – Fertility Rate Example Again! Why not just add a squared and a cubed time term to the model. This is now a cubic model in time: Warning – this is starting to border on “curve fitting”
Time Trends – Fertility Rate Example Again! Adding more polynomial terms in t allows us to model any time series pretty well. But, Model gets overly complicated We are just playing “connect-the-dots” and missing broad trends in the data This offers little help in finding important explanatory variables
Time Trends – Cheese! Open the CHEESE data set which contains U.S. production of blue and gorgonzola cheeses over many years. Is there a linear trend? Fit this model:
Time Trends – Cheese! How is this model: ? What did the model tell you about explanatory variables that affect blue and gorgonzola cheese production?
Stationary Time Series Definition: A stationary time series process is one in which the probability distribution(s) that generate the time series are stable over time. In other words, if we take any consecutive collection of random variables in the series and shift it ahead or back h time periods, the probability distribution(s) remain unchanged.
Stationary Time Series – Example Pharmaceutical Product Sales
Stationary Time Series – Example How do we know Pharmaceutical Product Sales is a stationary process? Things to examine: No time effect Lag scatter plots Sample Autocorrelation Function (ACF)
Stationary Time Series – Example Lets examine time effect in the Pharmaceutical Product Sales data How do we do this?
Lets examine time effect in the Pharmaceutical Product Sales data How do we do this? Regress the data against time (or maybe time and time squared)
Pharmaceutical Product Sales regressed against time (week) Sales, in Thousands = 10368 + 0.184 Week Predictor Coef SE Coef T P Constant 10368.0 40.1 258.58 0.000 Week 0.1844 0.5751 0.32 0.749 S = 218.244 R-Sq = 0.1% R-Sq(adj) = 0.0% NO TIME EFFECT
Pharmaceutical Product Sales regressed against time (week) and time squared Sales, in Thousands = 10405 - 1.62 Week + 0.0149 Week Squared Predictor Coef SE Coef T P Constant 10404.6 60.9 170.93 0.000 Week -1.618 2.322 -0.70 0.487 Week Squared 0.01490 0.01859 0.80 0.425 S = 218.576 R-Sq = 0.6% R-Sq(adj) = 0.0% NO TIME EFFECT
Pharmaceutical Product Sales has no time effect. What does no time effect imply – constant mean Estimate the constant mean of the Pharmaceutical Product Sales data.
Stationary Time Series – Example Lets examine lag scatter plots with the Pharmaceutical Product Sales data. Make new lag plus 1 variable in Minitab Make scatter plot of data vs. lag plus 1
Scatter plot of data vs. lag plus 1 What does this graph imply?
Stationary Time Series – Example Can explore other lags Make new lag plus 2 variable in Minitab Make scatter plot of data vs. lag plus 2
Scatter plot of data vs. lag plus 2 What does this graph imply?
Stationary Time Series – Example Lets examine the Sample Autocorrelation Function What is an autocorrelation function?
What is an autocorrelation function? Autocorrelation coefficient at lag k is: The collection of is called the autocorrelation function (ACF).
What is an autocorrelation function? Autocorrelation coefficient at lag k is: What is a variance?
What is an autocorrelation function? Autocorrelation coefficient at lag k is: What is a covariance?
What is a covariance? covariance is a measure of how much two random variables change together.
What is a covariance? If the greater values of one variable mainly correspond with the greater values of the other variable, the covariance is a positive number. If the greater values of one variable mainly correspond to the smaller values of the other, the covariance is negative. The sign of the covariance therefore shows the tendency in the linear relationship between the variables.
Stationary Time Series – Example Lets examine the Sample Autocorrelation Function Minitab will estimate the Autocorrelation Function from a set of time series data – the Sample Autocorrelation Function
Stationary Time Series – Example For the pharmaceutical product sales data: Lag ACF T LBQ 1 0.112486 1.23 1.56 2 0.012543 0.14 1.58 3 -0.223825 -2.42 7.84 4 -0.193314 -2.00 12.56 5 -0.113943 -1.14 14.21 6 0.014538 0.14 14.24 7 0.078927 0.78 15.05 8 0.045591 0.45 15.32 9 0.000628 0.01 15.32
Stationary Time Series – Example The graph is usually more useful
Stationary Time Series – Example Open Stationary Time Series Example data set and explore the following Time effect present? What do lag scatter plots tell us? What does ACF tell us? Is this data set a stationary time series?
Stationary Time Series – Example Open Cheese data set and explore the following Time effect present? What do lag scatter plots tell us? What does ACF tell us? Is this data set a stationary time series?