Download

1 / 23
230 likes | 341 Views
Explore seismic evidence for present-day plume upwelling at the core-mantle boundary, including ULVZ detection, waveform variations, and mantle structure insights. Data analysis and modeling results provide valuable information on chemical heterogeneity and partial melt dynamics. Understand the physical models and experimental correlations related to mantle upwellings.

E N D
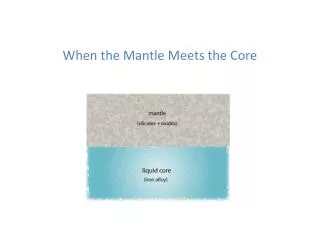
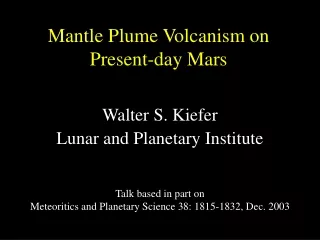
Seismic evidence for present-day plume upwelling at the core-mantle boundary Sebastian Rost Edward J. Garnero Quentin Williams University of California Santa Cruz Michael Manga University of California Berkeley
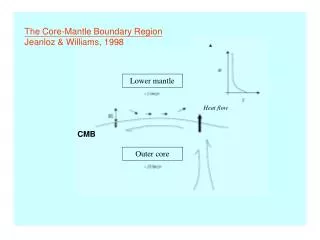
ULVZ structure and detection • 0.5 to 10’s km thick • 10 to 30 % velocity decrease • density ? • CMB are probed < 50 % • ULVZ evidence < 10% (of CMB area) Thorne and Garnero, 2004
ScP waveform variations ScP waveform variations
Using two small-scale arrays Topography from NOAA 2’ dataset
WRA dataset • - Tonga-Fiji seismicity • deep earthquakes • 97 earthquakes • Seismicity from: • 10/1990 – 01/1998
ASAR dataset • - 51 earthquakes • deep seismicity • Seismicity from: • 11/1996 – 12/2000
WRA double-beam All precursor events + summation trace Precursor summation trace Non-precursor summation
WRA double-beam All precursor events + summation trace Precursor summation trace Non-precursor summation
ScP/P waveform comparison WRA : 0.5Hz – 1.4Hz ASAR: 1Hz – 3 Hz Higher ASAR resolution gives evidence for SdP and perhaps SPcP
ScP CMB sampling Tomo from Ritsema and van Heijst, 2002
ScP ULVZ evidence • - ~50 by 50 km • northern boundary –24.5 • southern boundary –25.5 • some boundaries not well • resolved CRZ evidence from Rost & Revenaugh, Science, 2001
Forward modeling parameter space • 1D Gaussian Beam Synthetics • constant layer velocity • ScP, ScsP, SdP, SPcP • PREM background • sharp upper boundary • 4 parameter grid-search
Best fit grid-search Chemical Heterogeneity Partial Melt
Data and modeling results • Best-fit model properties: • Thickness : 8.5 (1) km • DVP : -10 (2.5) % • DVS : -25 (4) % • Dr : +10 (5) % • DVP/DVS indicates partially molten material • ~50 by 50 km lateral extension • small lateral extent raises stability questions • High-frequency data indicate very sharp upper boundary • sharpness < 400 m
Data and modeling results red: lowest velocities for S20RTS green: strongest VS gradients Thorne et al., 2004 • Experiment probes very slow mantle (Ritsema and van Heijst, 2002) • Region of strong lateral gradient chemical heterogeneity (Thorne et al., 2004) • Probably dense material at CMB (McNamara and Zhong, 2004)
Preferred physical model • 5 to 30 vol.% melt • no spreading along CMB • trapped intercumulus liquid • incompatible-element enriched liquid • crystals are initially over- grown and trap residual • requires large overlying thermal anomaly • downward percolation of melt • correlation to dynamic instabilities/upwellings • probably a fixed base for mantle upwellings
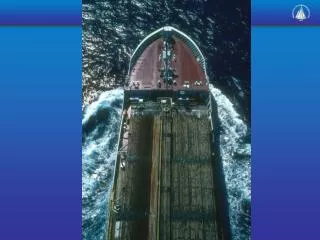
Similar Tank experiment D” aspect ratio of tank experiment !! (from Jellinek and Manga, RoG, 2004)
Preferred physical model • 5 to 30 vol.% melt • no spreading along CMB • trapped intercumulus liquid • requires large overlying thermal anomaly • downward percolation of melt • incompatible-element enriched liquid • correlation to dynamic instabilities/upwellings • probably a fixed base for mantle upwellings