Download
1 / 43
430 likes | 533 Views
Explore insights on commodity prices & farmland values shared by Mark Pearson in a conference in Nashville. Discover trends in corn, soybean, wheat, and more affecting the global market.

E N D
What’s Aheadfor COMMODITY PRICES & FARMLAND VALUES Remarks by Mark Pearson Independent Community Bankers Nashville, TennesseeMarch 12, 2012
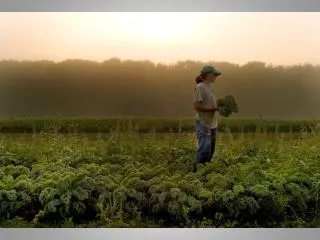
Back in Production… Any Way Possible Source: Matt Leavitt
10-Year Corn Prices Source: NASS
Corn Use: Fuel versus Food 6 4 2 0 Bushels Feed Ethanol ‘02 ‘03 ‘04 ‘05 ‘06 ‘07 ‘08 ‘09 ‘10 ‘11 Source: USDA
U.S. Corn Ending Stocksas Percentage of Use Compliments of PHI Marketing
World Corn Ending Stocksas a Percentage of Use Compliments of PHI Marketing
USDA Corn Supply and Use 2010/11 est. (2/9/12) 2011/2012 proj. Area Planted 88.2 91.9 Area Harvested 81.4 84.0 Yield 152.8 147.2 Beginning Stocks 1,708 1,128 Production 12,447 12,358 Imports 28 20 Supply, Total 14,182 13,506 Feed & Residual 4,793 4,600 Food, Seed & Industrial 6,428 6,405 Domestic Use, Total 11,220 11,005 Exports 1,835 1,700 Use, Total 13,055 12,705 Ending Stocks 1,128 801 Average Farm Price $5.18 $5.80-$6.60 Compliments of PHI Marketing
World Corn Supply and Use 2009-10 2010-11 (est.) 2011-12 (proj.) Beginning Stocks 147.54 144.18 128.83 Production 819.23 827.54 864.11 Imports 89.76 91.34 92.84 Feed 488.48 494.41 510.83 Total 822.60 842.89 867.59 Exports 96.82 90.45 94.93 Ending Stocks 144.18 128.83 125.35 Million Metric Tons Compliments of PHI Marketing
May ’12 Corn Source: CBOT
December ’12 Corn Source: CBOT
Light Sweet Crude Oil Source: NYMEX
10-Year Soybean Prices Source: NASS
Brazil’s Big Ag Expansion 2011-21 75% 60% 50% 40% 30% 20% 10% 0% Production 24% 46% 36% 39% 48% 68% Exports Coffee Soybeans Cotton Source: DTN
U.S. Soybean Ending Stocks As % of Use Compliments of PHI Marketing
World Soybean Ending Stocksas Percentage of Use Compliments of PHI Marketing
USDA Soybean Supply and Use 2010/11 Est. (2/9/12) 2011/2012 Projected Area Planted 77.4 75.0 Area Harvested 76.6 73.6 Yield (bushels per acre) 43.5 41.5 Beginning Stocks 151 215 Production 3,329 3,056 Imports 14 15 Supply, Total 3,495 3,286 Crush 1,648 1,615 Exports 1,501 1,275 Seed 87 88 Residual 43 32 Use, Total 3,280 3,011 Ending Stocks 215 275 Average Farm Price $11.30 $11.10-$12.30 Compliments of PHI Marketing
World Soybean Supply and Use 2009/102010/11 (est.)2011/2012(Proj.) Beginning Stocks 42.72 59.60 68.90 Production 260.85 264.18 251.47 Imports 86.83 88.83 90.76 Crush 209.50 221.09 227.42 Total 238.25 251.74 258.05 Exports 92.55 91.97 92.79 Ending Stocks 59.60 68.90 60.28 Million Metric Tons Compliments of PHI Marketing
May ’12 Soybeans Source: CBOT
November ’12 Soybeans Source: CBOT
10-Year Wheat Prices Source: NASS
USDA Wheat Supply and Use 2010/11 (2/9/12) 2011/2012 Projected Area Planted 53.6 54.4 Area Harvested 47.6 45.7 Yield (bushels per acre) 46.3 43.7 Beginning Stocks 976 862 Production 2,207 1,999 Imports 97 120 Supply, Total 3,279 2,982 Food 926 935 Seed 71 82 Feed & Residual 132 145 Exports 1,289 1,162 Use, Total 2,417 2,137 Ending Stocks 862 845 Average Farm Price $5.70 $7.15-$7.45 Compliments of PHI Marketing
World Wheat Supply and Use 2009/102010/11(est.)2011/2012 (Proj.) Beginning Stocks 167.05 202.34 200.70 Production 685.43 651.61 692.88 Imports 133.58 130.07 135.91 Feed 115.36 112.42 130.66 Total 650.14 653.24 680.48 Exports 135.80 131.82 140.25 Ending Stocks 202.34 200.70 213.10 Million Metric Tons Compliments of PHI Marketing
U.S. Wheat Ending Stocks As % of Use Compliments of PHI Marketing
World Wheat Ending Stocks As Percentage of Use Compliments of PHI Marketing
May ’12 Chicago Wheat Source: CBOT
December ’12 Chicago Wheat Source: CBOT
10-Year Cotton Prices Source: NASS
May ’12 Cotton Source: CBOT
December ’12 Cotton Source: NYMEX
10-Year Cattle Prices Source: NASS
April ’12 Live Cattle Source: CBOT
December ’12 Live Cattle Source: CBOT
April ’12 Feeder Cattle Source: CBOT
November ’12 Feeder Cattle Source: CBOT
January Milk Cows 2002-12 Source: NASS
April ’12 Class III Milk Source: CBOT
December ’12 Class III Milk Source: CBOT
10-Year Hog Prices Source: NASS
April ’12 Lean Hogs Source: CBOT
December ’12 Lean Hogs Source: CBOT
Inflation Adjusted Farmland Values 1964-2010 Source: Chicago Federal Reserve
Globally Local World: What’s Ahead • Recovering economy • Demographics will drive ag/food product demand • Next world industrial expansion: Africa • U.S. continues to be ag technology leader • U.S., China will drive African development • Infrastructure build-out continues in South America • ‘Youth bulge’ means growth in Middle East, but continued destabilization following Arab Spring • What’s this mean for you: Continued strong demand for U.S. agricultural commodities
![Global economic crisis, commodity prices and development implications [ presented @ ATN12, Accra, August’09 ]](https://cdn0.slideserve.com/317044/slide1-dt.jpg)