Download
1 / 40
400 likes | 559 Views
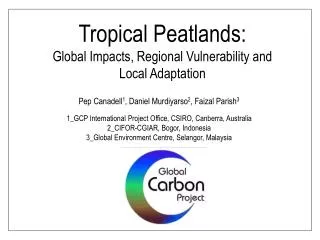
Impacts of and vulnerability to global change in Europe. Dagmar Schröter and the ATEAM consortium. Potsdam Institute for Climate Impact Research. Overview. 1 Vulnerability Elements General objective 2 European vulnerability assessment Specific objectives

E N D
Impacts of and vulnerability to global changein Europe Dagmar Schröter and the ATEAM consortium Potsdam Institute for Climate Impact Research
Overview 1 Vulnerability • Elements • General objective 2 European vulnerability assessment • Specific objectives • Environmental dimension of vulnerability • Consistent set of exposure scenarios • Potential impacts on ecosystem service supply • V = f(potential impacts, adaptive capacity) • Digital atlas: The ATEAM mapping tool 3 Recap questions, draw conclusions
Vulnerability: potential for harm exposure sensitivity adaptive capacity potential impact vulnerability
General objective of vulnerability assessment • to inform the decision-making of stakeholders about options for adapting to the effects of global change • facilitate sustainable development Schröter, Polsky, and Patt 2004. Mitigation and Adaptation Strategies for Global Change, next issue. In press.
European vulnerability study • Examples of questions to tackle • Which regions are most vulnerable to global change? • Which sectors are the most vulnerable in a certain region? • Which scenario is the least harmful for a sector? Specific Objectives 1. To assess potential impacts of global change on ecosystem services in Europe 2. To translate these impacts into maps of our vulnerability ATEAM-project, www.pik-potsdam.de/ateam 17 partners and sub-contractors, Funded by the European Union, 2001-2004.
food production slope stability tourist attraction fire prevention water storage biodiversity pollination fibre production fodder production flood protection carbon sequestration beauty recreation stabilising micro-climate game reserve shelter for lifestock • The environmental dimension of vulnerability • Ecosystems provide services that sustain and fulfill human life(see MA book, Alcamo et al. 2003) • to know the potential impacts of global change on ecosystem services within a specific region is to understand an essential part of this region’s vulnerability.
maps of vulnerability combined indicators European Vulnerability Assessment Methodology multiple scenarios of global change: CO2climate, socio-econ.land use,N deposition changes in ecosystem services ecosystem models changes in adaptive capacity socio-economic dialogue between stakeholders and scientists Metzger & Schröter 2004 (submitted).
Exposure: Multiple coupled drivers NOx CO2 NHyCH4
Consistent global change scenarios As input to our ecosystem and adaptive capacity models. • Based on SRES narratives A1fi, A2, B1, B2 • Spatially explicit: downscaled to 10' x 10' (ca. 16 x 16 km) • 4 time slices (1990, 2020, 2050, 2080) • 4 Socio-Economic Scenarios • 4 Emission Trajectories (greenhouse gases) • 17 Climate Scenarios (four climate models, one control) • 7 Land Use Scenarios • 4 Nitrogen Deposition Scenarios Multiple drivers, multiple plausible scenarios.
Climate scenarios: relative to 1961-1990 Temperature Change (°C) Precipitation Change (%) Europe, 4 GCMs, 4 SRES Mitchell, Hulme et al. 2004 (in review).
Climate change scenarios –temperature Regional variability and comparison of different climate models (GCMs).Anomaly2091-2100 vs. 1991-2000 (SRES A2) Mitchell, Hulme et al. 2004 (in review).
Climate change scenarios –precipitation Regional variability and comparison of different climate models (GCMs).Anomaly2091-2100 vs. 1991-2000 (SRES A2) Mitchell, Hulme et al. 2004 (in review).
Land use change scenarios % of European land surface Rounsevell, Reginster et al. 2004 (in prep).
Nitrogen depositionComparison with pre-industrial times Northern hemisphere temperate ecosystems Nitrogen effects biodiversity, the carbon cycle and all ecosystem services that are linked to these. Holland et al. 1999, Biogeochemistry 46, 7-43.
N deposition scenarios ...under construction... Posch 2002, Alcamo et al. 2002, IMAGE 2001
maps of vulnerability combined indicators European Vulnerability Assessment Methodology multiple scenarios of global change: CO2climate, socio-econ.land use,N deposition changes in ecosystem services ecosystem models changes in adaptive capacity socio-economic dialogue between stakeholders and scientists Metzger & Schröter 2004 (submitted).
Sectors, ecosystem services and modelled indicators Metzger & Schröter 2004 (submitted).
Agriculture • Decline in arable land (cropland, grassland) • Surplus land (up to over 10% of European land surface) • Land demand for bioenergy may go up, CO2 offset may approach 15% of 1990-emissions in 2080 • Climate driven decline in soil organic carbon, partly counteracted by land use and stimulated plant growth • Crop suitabilitiy changes; some current agricultural areas become too hot and too dry to support agriculture
One climate model, four emission trajectories Four climate models,one emission trajectory 2000 2020 2050 2080 2000 2020 2050 2080 Soil organic carbon stocks Grassland soils may lose carbon (up to 22% of Kyoto committment). Smith et al. 2004 (in prep).
Forestry • Increase in forest area under all but one socio-economic scenario • Positive effects of climate change on growing stocks in Northern Europe • Negative effects in some regions, e.g. drought and fire in the Mediterranean • Distribution of tree species is projected to change, e.g. cork oak, holm oak, some pine species
Mediterranean: increased fire risk Example Spain Zaehle et al. 2004 (in prep).
Carbon storage • Europe‘s terrestrial biosphere currently acts as a small carbon sink • Despite considerable regional differences all scenarios show a weakening of this carbon sink after 2050 • Positive effects of reforestation, negative effects of climate change • Forests accumulate carbon • Soil loses carbon in boreal forests(more than trees take up) • Drought stress and increased fire riskin Mediterranean
Declining carbon sink after 2050 Land use and climate change together:negative effect, sink declines Land use change only:positive effect, sink increases Zaehle et al. 2004 (in prep).
Water • By the 2030s runoff increases in Northern Europe (by up to 10% annually) and decreases in Southern Europe (by up to 25% annually) • Runoff seasonality changes in Northern and upland Europe (increasing proportion of precipitation falls as rain rather than snow) • Pattern in seasonality change in alpine catchments • loss of water storing snow cover • Monthly peak flow shifts to earlier date and decreases • reduction in summer runoff
Alpine runoff regimes Example Dischma valley, 2051 - 2080 mm month Zierl et al. 2004 (in prep).
Mountain tourism • Elevation of a reliable snow cover will rise between 200 and 400 m from about 1300 m today to 1500-1700 m at the end of the 21st century. • Presently about 85% of Swiss ski areas have sufficient snow. A 300 m rise of the snow line would reduce this to ca. 63%. • Increase in winter precipitation can partly compensate, but cannot prevent upward shift.
A1FI A2 B1 B2 A2_CGCM2 A2_CSIRO2 A2_PCM2 Elevation of snow reliability (m a.s.l.) Alptal Hirschbichl Dischma year year year Saltina Verzasca year year Elevation moves up ca. 150 m per degree °C warming. Zierl et al. 2004 (in prep).
Biodiversity • Changes in plant and animal species composition in the order of 40% in many parts of Europe by 2050(projections of 1350 plant, 157 mammal, 383 breeding bird, 108 reptile and amphibia species) • Hot spots of change: Iberian Peninsula, Central Europe, and Scandinavia. • Nature reserves may lose 6-11% of species in next 50 years due to climatic shifts
maps of vulnerability combined indicators European Vulnerability Assessment Methodology multiple scenarios of global change: CO2climate, socio-econ.land use,N deposition changes in ecosystem services ecosystem models changes in adaptive capacity socio-economic dialogue between stakeholders and scientists Metzger & Schröter 2004 (submitted).
Integration: Vulnerability Visual overlay 2080A1 PI potential impact vulnerability AC adaptive capacity V = f(PI, AC) A relationship that is not specified beyond high PI and low AC high V, etc...
… our digital atlas: ATEAM mapping tool Ca. 3200 maps and many more summarising charts. Under construction...
multiple scenarios of global change: CO2climate, socio-econ.land use,N deposition Potential impacts ecosystem models maps of vulnerability changes in adaptive capacity socio-economic combined indicators dialogue between stakeholders and scientists ...which areas, and who is vulnerable to global change? How can we adapt? Schröter et al. 2004 (in press), Metzger & Schröter 2004 (submitted).
Conclusions: Vulnerability in Europe • Vulnerable region: Mediterranean seems most vulnerable within Europe -multiplepotential impactsandlow generic adaptive capacity • Vulnerable sectors: • Agriculture? Soil.Potential for less intensive farming. How do farmers decide? CAP... • Forestry? Fire risk.Biofuel potential. Shift to other species. • Carbon storage. Soil respiration and fire vs. plant growth: Declining sink 2050. • Mountain tourism. Reliable snowcover declines. Risks and discomfort? • Water. Droughts, floods. Seasonality changes.Hydropower, storage capacity. • Biodiversity.Current debate. Syndrome of impoverishment?Dynamic reserve management. • Dialogue between science and stakeholdersis an important part of the results. Should be informed by best science, fair, focussed and sustained. Coordination,moderation, sociallearning. • The digital Atlas developed with stakeholders is a useful communication tool in this dialogue. Which results, scales, scenarios will be most helpful to stakeholders?
Thank you! Toledo Spain Sweden European Forest InstituteJoensuu,Finland UCL, Belgium Paris, France Barcelona, Spain SilsoeBedford, United Kingdom Institute of Arable CropsResearch, Rothamsted, United Kingdom Montpellier, France Switzerland Finnish Environment Institute, Helsinki, Finland Wageningen Universiteit University of Life Sciences The Netherlands University of SheffieldUnited Kingdom Max Planck Institute for Biogeochemistry, Germany Department of Plant & Soil Science United Kingdom PIK, Germany USA United Kingdom The ATEAMPartners Project leader: Wolfgang Cramer & steering committee Scientific coordinator:Dagmar Schröter www.pik-potsdam.de/ateam
Next slides may help for specific questions from the audience...
Adaptive capacity ‘the capacity to innovate’ (Paul Raskin) • Knowledge • Awareness • Understanding • Will • Trust • Motivation • Values • Urgency • Power • Freedom • Equity • Technology • Wealth Countries Provinces Cities Villages Sectors Groups Individuals
Determinants Indicators Components Index Female activity rate Equality Income inequality Awareness Literacy rate Knowledge Enrolment ratio R & D expenditure Technology Number of patents Adaptive Capacity Ability N. of telephone lines Infrastructure Number of doctors GDP per capita Flexibility Age dependency ratio Action World trade share Economic Power Budget surplus Adaptive Capacity ‘the ability to implement planned adaptation measures’(based on IPCC TAR) 1990 2080A1 0.0 –1.0
economic A1 A2 global regional B1 B2 environmental Adaptive Capacity 2080 economic A1 This may be one useful dimension, but... What does this index really show? What about the individual dimension? Can AC be captured by a quantitative indicator? A2 global regional B1 B2 environmental Klein et al., in prep. Schröter et al. 2003. Paper presented at the Open Meeting of the Human Dimensions of Global Environmental Change Research Community, Montreal, Canada. Available online http://sedac.ciesin.columbia.edu/openmtg/.
Euglypha strigosa Nebela lageniformis Actinomycete spores Schoenbornia humicola Bullinularia indica Cantharellus cibarius atmospheric N deposition 0 negligible N intermediate NN high Acari Nematode mouthparts Dicyrtoma fusca Why does N matter? EU transect: N gradient Decomposer food web • N deposition effects:shift in food web structure(fungal based bacterial based) and enhanced mineralisation rates • could that counteract increased C storage in vegetation? Schröter et al. 2003. Oikos 102: 294-308.
Motivation: Observed impacts • Recent reviews summarise observations of global change effects in a wide range of ecosystems on various scales • climate change only: Parmesan and Yohe 2003, Root et al. 2003, O'Brien et al. 2004, Stenseth et al. 2002, Walther et al. 2002 • a variety of global change drivers:Smith et al. 1999, Sala et al. 2000, Stevens et al. 2004 • Effects on phenology, species ranges and distribution of plants and animals, and the composition and dynamics of communities - But why should we care?