Download
1 / 81
820 likes | 976 Views
Logistic regression is used when a few conditions are met:. 1. There is a dependent variable. 2. There are two or more independent variables. 3. The dependent variable is binary, ordinal or categorical. Medical applications. Symptoms are absent, mild or severe

E N D
Logistic regression is used when a few conditions are met: • 1. There is a dependent variable. • 2. There are two or more independent variables. • 3. The dependent variable is binary, ordinal or categorical.
Medical applications • Symptoms are absent, mild or severe • Patient lives or dies • Cancer, in remission, no cancer history
Marketing Applications • Buys pickle / does not buy pickle • Which brand of pickle is purchased • Buys pickles never, monthly or daily
GLM and LOGISTIC are similar in syntax • PROC GLM DATA = dsname; • CLASS class_variable ; • model dependent = indep_var class_variable ; PROC LOGISTIC DATA = dsname; CLASS class_variable ; MODEL dependent = indep_var class_variable ;
That was easy … • …. So, why aren’t we done and going for coffee now?
Why it’s a little more complicated • The output from PROC LOGISTIC is quite different from PROC GLM • If you aren’t familiar with PROC GLM, the similarities don’t help you, now do they?
Important Logistic Output • · Model fit statistics • · Global Null Hypothesis tests • · Odds-ratios • · Parameter estimates
A word from an unknown person on the Chronicle of Higher Ed Forum Being able to find SPSS in the start menu does not qualify you to run a multinomial logistic regression
Logarithms, probability & odds ratios • In five minutes or less
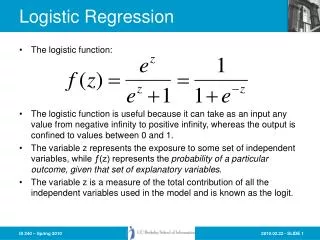
Points justifying the use of logistic regression • Really, if you look at the relationship of a dichotomous dependent variable and a continuous predictor, often the best-fitting line isn’t a straight line at all. It’s a curve.
You could try predicting the probability of an event… • … say, passing a course. That would be better than nothing, but the problem with that is probability goes from 0 to 1, again, restricting your range.
Maybe use the odds ratio ? • which is the ratio of the odds of an event happening versus not happening given one condition compared to the odds given another condition. However, that only goes from 0 to infinity.
When to use logistic regression: Basic example #1 • Your dependent variable (Y) : • There are two probabilities, married or not. We are modeling the probability that an individual is married, yes or no. • Your independent variable (X): • Degree in computer science field =1, degree in French literature = 0
Step #1 • A. Find the PROBABILITY of the value of Y being a certain value divided by ONE MINUS THE PROBABILITY, for when X = 1 • p / (1- p)
Step #2 • B. Find the PROBABILITY of the value of Y being a certain value divided by ONE MINUS THE PROBABILITY, for when X = 0
Step #3 • B. Divide A by B • That is, take the odds of Y given X = 1 and divide it by odds of Y given X = 2
Example! • 100 people in computer science & 100 in French literature • 90 computer scientists are married • Odds = 90/10 = 9 • 45 French literature majors are married • Odds = 45/55 = .818 • Divide 9 by .818 and you get your odds ratio of 11 because that is 9/.818
Now that you understand what the odds ratio is … • The dependent variable in logistic regression is the LOG of the odds ratio (hence the name) • Which has the nice property of extending from negative infinity to positive infinity.
A table (try to contain your excitement) The natural logarithm (ln) of 11 is 2.398. I don’t think this is a coincidence
If the reference value for CS =1 , a positive coefficient means when cs =1, the outcome is more likely to occur • How much more likely? Look to your right
The ODDS of getting married are 11 times GREATER If you are a computer science major
Actual Syntax • Thank God! Picture of God not available
PROC LOGISTIC data = datasetname descending ; • By default the reference group is the first category. • What if data are scored • 0 = not dead • 1 = died
CLASS categorical variables ; Any variables listed here will be treated as categorical variables, regardless of the format in which they are stored in SAS
Independents • County • # Visits to program • Gender • Age
PROC LOGISTIC DATA = stats1 DESCENDING ; • CLASS gender county ; • MODEL job = gender county age visits ;
Probability modeled is job=1. Note: 50 observations were deleted due to missing values for the response or explanatory variables.
This is bad Model Convergence Status Quasi-complete separation of data points detected. Warning: The maximum likelihood estimate may not exist. Warning: The LOGISTIC procedure continues in spite of the above warning. Results shown are based on the last maximum likelihood iteration. Validity of the model fit is questionable.
Quasi-complete separation Like complete separation BUT one or more points where the points have both values 1 1 2 1 3 1 4 1 4 0 5 0 6 0
“For any dichotomous independent variable in a logistic regression, if there is a zero in the 2 x 2 table formed by that variable and the dependent variable, the ML estimate for the regression coefficient does not exist.” • Depressing words from Paul Allison
Solution? • Collect more data. • Figure out why your data are missing and fix that. • Delete the category that has the zero cell.. • Delete the variable that is causing the problem
Nothing was significant & I was sad
Let’s try something else! • Hey, there’s still money in the budget!
Maybe it’s the clients’ fault Proc logistic descending data = stats ; Class difficulty gender ; Model job = gender age difficulty ;