Download
1 / 14
140 likes | 220 Views
Agec 420. Homework #7 Charting Review Quiz 7. Markets. CBOT: http://www.cbot.com/ CME: http://www.cme.com/. Readings on Technical Analysis. Purcell : Chapter 4 on the Bar Chart describes many chart patterns, their “reliability” Chapter 5: section on moving averages Malkiel :

E N D
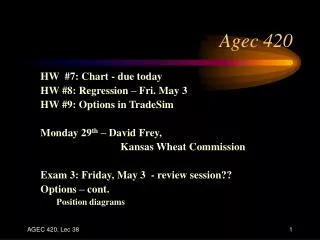
Agec 420 • Homework #7 • Charting • Review Quiz 7
Markets • CBOT: http://www.cbot.com/ • CME: http://www.cme.com/
Readings on Technical Analysis Purcell: Chapter 4 on the Bar Chart describes many chart patterns, their “reliability” Chapter 5: section on moving averages Malkiel: Chapters 5 and 6 disputes the claim of “reliability”
Charts Trends and reversals Tops, bottoms, (Head & Shoulders) Other reversal patterns • Key, Hook, Island reversals • See Purcell text for others: • Consolidation patterns – flags, pennants • Gaps and Corrections
Technical Vocabulary “The market’s rise after a period of reaccumulation is a bullish sign. Nevertheless, fulcrum characteristics are not net clearly present and a resistance area exists 40 points higher in the Dow, so it is clearly premature to say the next leg of the bull market is up. If, in the coming weeks, a test of the lows holds and the market breaks out of its flag, a further rise would be indicated. Should the lows be violated, a
cont. continuation of the intermediate term downtrend is called for. In view of the current situation, it is a distinct possibility that traders will sit in the wings awaiting a clearer delineation of the trend and the market will move in a narrow trading range.”
Final thought … • If a well known buy signal is “reliable” ---- who would sell? • Same argument applies to fundamental analysis !!
Indices and Moving Averages Purcell: Chapter 4: RSI Chapter 5: Section on moving averages
Relative Strength Index (RSI) • measures market “momentum” • based on price changes in the previous 14 days • Signals whether market is “overbought” or “oversold”
Calculating RSI • record the last 14 price changes • calculate D • sum the negative changes, divide by 14 • calculate U • sum the positives, divide by 14 • RSI = U/U+D (%) see Purcell, Ch. 4
Using RSI • RSI > 70% • “overbought” market • all traders who want to buy are in • market running out of momentum • price decline imminent --> prepare to sell • RSI < 30% • signals an oversold market • a buy signal
Moving Averages • to monitor trends • 3-day moving average • add the last 3 closing prices; divide by 3 • by construction, behaves more smoothly than the daily price • reveals the trend • See Purcell, Ch 5
Using Moving Averages • use 2 moving averages • long (e.g. 18 day) --> reveals trend • short (e.g. 9 day) --> reveals change in trend • get signals when lines cross • short crosses long moving up --> buy • short crosses long moving down --> sell
Other technical systems • Stochastic oscillators (%k and %d) • Elliot wave theory • Bollinger bands • Andrew’s pitchfork • Zig Zag indicator See www.equis.com/free/taaz/