Simulating Stimulating Interfaces Applications in Adsorption and Catalysis
210 likes | 325 Views
Explore how simulation methods can aid in understanding the complex performance dynamics of solid-oxide fuel cells at the atomic level, focusing on cathode interfaces and kinetic reactions. Investigate factors like temperature, gas pressure, and materials affecting cell efficiency. Simulation sizes range from Kinetic Monte Carlo to Ab Initio methods.

Simulating Stimulating Interfaces Applications in Adsorption and Catalysis
E N D
Presentation Transcript
Simulating Stimulating InterfacesApplications in Adsorption and Catalysis C. Heath Turner and Xian Wang Department of Chemical and Biological Engineering The University of Alabama Kah Chun Lau Department of Chemistry, George Washington University Brett I. Dunlap Code 6189, Naval Research Laboratory, Washington D. C. Financial Support Provided by the Office of Naval Research
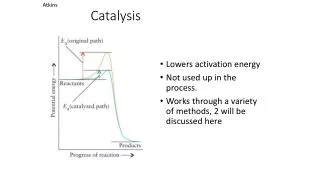
Solid Oxide Fuel Cells • Performance Characteristics… • Mainly for stationary applications with an output from 100 W to 2 MW. • They typically operate at temperatures between 700 and 1,000°C. • Efficiency can be as high as 90% (when the off-gas is used to fire a secondary gas turbine). • Due to the high operating temperature, no need for expensive catalyst. • SOFC are not poisoned by CO and this makes them highly fuel-flexible. So far they have been operated on methane, propane, butane, fermentation gas, gasified biomass, etc. • Thermal expansion demands a uniform and slow heating process at startup (typically, 8 hours or more). …we will focus on the cathode interface
SIMULATION SIZES and METHODS TIME (s) 100 Kinetic Monte Carlo Continuum Methods 10-2 Mesoscale Methods 10-4 Classical Methods 10-6 10-8 Semi-Empirical Methods 10-10 10-12 Ab Initio Methods 10-14 10-16 10-5 10-4 10-3 10-7 10-6 10-10 10-9 10-8 LENGTH (m)
Understanding the Performance of Solid-Oxide Fuel Cells Determining how fuel cell materials respond at the atomic level to the global operation dynamics, and locally, due to interconnected micro or nanostructures, is a looming challenge. Many variables to consider… …how are they all correlated? …how is SOFC performance affected? • Temperature • Partial Pressure of the Gases • Bias Voltage • Geometry/Surface Area • Cathode/Anode Materials • Electrolyte Material, Dopant Level Difficult to isolate experimentally, but given an appropriate model, simulations can lend some help
THE MODEL • We focus on the cathode-side of the electrolyte interface. • the anode side and the associated reactions are ignored • The electrolyte is yttrium-stabilized zirconia (YSZ) • the dopant level can vary, which affects the oxygen vacancy fraction • The oxygen partial pressure can vary (PO2) • this affects the O2 adsorption rate • The temperature (T) can vary • this affects the O2 adsorption/desorption equilibrium, the elementary chemical kinetics, and the ionic diffusivity in the YSZ • The bias voltage can vary • this affects the oxygen incorporation • reactions at the SOFC interface • Current can be measured by monitoring the flux of ions through the YSZ. • The electric double-layer can be incorporated into the model. • Concentration profiles, surface coverage, and electrochemical information can be extracted.
THE MODEL Structural Details • Structure corresponds to YSZ (100) surface of the bulk cubic fluorite (Fm3m) crystal…thermodynamically stable phase of zirconia at high T. • A fixed Fm3m lattice parameter of 5.14 Å for 9 mol % YSZ is assumed. • The YZr and Zr ions are fixed during the oxide ion vacancy migration. • Other thermally, chemically, or electrically induced chemical or morphological changes are not included. • YSZ: conducts only oxygen ions, electronic insulator. • Neglect electrode details…assume electrode/YSZ TPB accounts for 1% of total surface area (used to normalize the calculated current). • Default Simulation Parameters: • PO2 = 0.30 atm • T = 1073 K • V = -0.50 V • relative permittivity = 40 • D = ~10 nm • Area = ~32 nm2 • 9 mol % YSZ K. C. Lau, C. H. Turner, B. I. Dunlap, Solid State Ionics179, 1912 (2008).
Kinetic Monte Carlo Simulations Electrostatic Interactions Gas Adsorption Bulk YSZ • Total potential (VT) = electrode (Ve) + space-charge (Vsc) • Ve = electric potential from electrode (evenly distributed along YSZ) • Vsc = local space-charge (due to distribution of charges within YSZ) • Poisson equation of electrostatics: 3D 1D • “Parallel Plate Capacitor” • Assume uniform charge distribution within each plane and use Gauss’ law. • The effective field influences the migration of the ions (when moving to neighboring plate, only) • Eeff = E0 + 0.5(q)VT K. C. Lau, C. H. Turner, B. I. Dunlap, Solid State Ionics179, 1912 (2008).
Kinetic Monte Carlo Simulation: Reaction Events Choose an event proportional to the rate of the event: Increment the clock by Dt: • Kinetic parameters taken from previous experiments and calculations.
Kinetic Monte Carlo Simulation of a Solid-Oxide Fuel Cell RESULTS • Is the current affected by the O2 partial pressure? • Is the trend consistent with experimental observations? • Is the same trend observed at LOWER voltages? K. C. Lau, C. H. Turner, B. I. Dunlap, Chem Phys Lett (2009), accepted.
Kinetic Monte Carlo Simulation of a Solid-Oxide Fuel Cell RESULTS • Is the current affected by the relative permittivity of the electrolyte? • Does the Y-dopant level strongly affect the current? • Is this consistent with the experiments? • Is the same trend observed at lower voltages?
Kinetic Monte Carlo Simulation of a Solid-Oxide Fuel Cell RESULTS • What is happening at the atomic level at the cathode interface? …concentration profiles of the individual species can give us some insight. …concentration profiles are consistent when the voltage is reversed.
Kinetic Monte Carlo Simulation of a Solid-Oxide Fuel Cell RESULTS • Can we model the frequency-response characteristics of the fuel cell? …apply an alternating bias voltage. simulation data… As the frequency increases, the electric double-layer begins to diminish…the voltage frequency becomes larger than the dynamics of the charge accumulation.
Kinetic Monte Carlo Simulation of a Solid-Oxide Fuel Cell RESULTS Z' Z'' (a) (b) (c) Double-layer capacitance (Cdl) Polarization resistance (Rp) Electrolyte resistance (Re)
Kinetic Monte Carlo Simulation of a Solid-Oxide Fuel Cell RESULTS (b) Fitted voltage Vcal, current density J, and phase angle shift
Kinetic Monte Carlo Simulation of a Solid-Oxide Fuel Cell RESULTS (a) (b) (c) Fitted voltage Vcal, current density J, and phase angle shift
Kinetic Monte Carlo Simulation of a Solid-Oxide Fuel Cell RESULTS (a) (b) (c) The relative oxide-ion vacancy concentrations of the YSZ layers
Kinetic Monte Carlo Simulation of a Solid-Oxide Fuel Cell RESULTS 101040 supercells Vo = -0.5 V Relative permittivity of YSZ r = 40 PO2=0.3 atm 101040 supercells T = 1073K Vo= -0.5 V Relative permittivity of YSZ r = 40 (a) (b) T = 1073 K Vo = -0.5 V Relative permittivity of YSZ r = 40 PO2 = 0.3 atm (c) X. Wang, K. C. Lau, C. H. Turner, B. I. Dunlap, J Electrochem Soc (2009), submitted.
Conclusions • Temperature, dopant fraction, and relative permittivity strongly affect the current density. • Frequency response analysis shows limiting current behavior and can be used to extract capacitance and resistance data. • An improved kinetics database is needed to bring the qualitative results closer to experimental values. • The SOFC model is being further developed, in order to include the anode side of the fuel cell. • We do not use adjustable parameters…we take parameters from quantum mechanical calculations and experiments, without modification.