Download
1 / 15
150 likes | 163 Views
Learn about the concept of measurement and its importance in physics. Discover how to compare and report measurements with uncertainty. Explore the difference between precision and accuracy, and how to identify variables in experiments. Get familiar with graphical analysis and linear relationships, and understand how to interpret data on graphs.

E N D
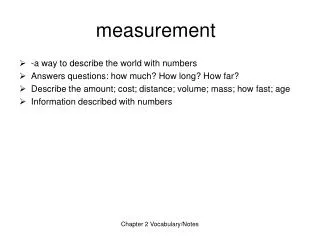
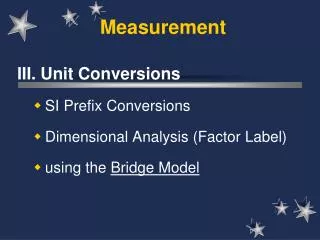
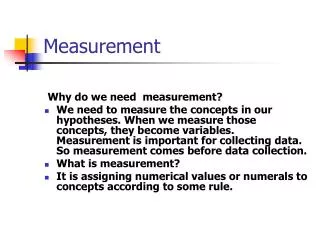
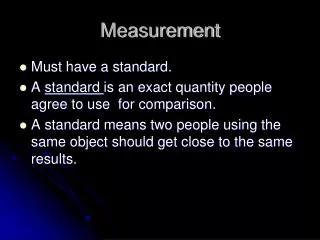
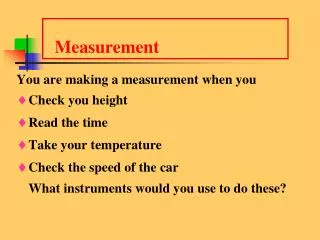
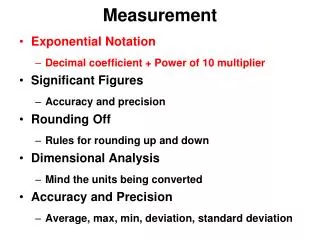
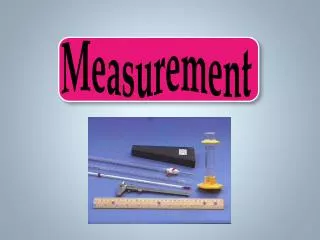
What is measurement? • A measurement is a comparison between an unknown quantity and a standard. • Measurements quantify observations. • Careful measurements enable you to derive the relationship between any two quantities. • What are some quantities you might measure during your study of physics?
Comparing Results • Measurements are often reported with uncertainty. • A new measurement that is within the margin of uncertainty confirms the old measurement. • For example, the ranges for the measurements of Student 1 and Student 2 overlap.
Precision Versus Accuracy • Precision is the degree to which multiple measurements agree with each other. • Accuracy describes how well the results of a measurement agree with the accepted value.
Identifying Variables • A variable is any factor that might affect the behavior of an experimental setup. • The independent variable is the factor that is changed or manipulated during the experiment. • The dependent variable is the factor that depends on the independent variable.
Identifying Variables • Graphs are one way to communicate data. They can show how the dependent variable changes with the independent variable. • A line graph shows how the dependent variable changes with the independent variable. • The line of best fit is drawn as close to all the data points as possible. • The line of best fit is a better model for predictions than any one point along the line.
Linear Relationships • When the line of best fit is a straight line, there is a linear relationship between the two variables. • In a linear relationship, the dependent variable varies linearly with the independent variable.
Linear Relationships • A linear relationship can be written as an equation: • y = mx + b • b is the y-intercept • m is the slope of the line.
Linear Relationships • The slope is the ratio of the vertical change to the horizontal change.
Data • Data collected is plotted on a graph with independent variable on x-axis and dependent variable on the y-axis
Are the calories related to the amount of fat?
Total Cal Total Fat
Regression Line • Line that “best fits” the data is drawn through the points • This line can be represented by an equation for the line