Download
1 / 31
320 likes | 439 Views
This study investigates soil performance predictions based on current test data, focusing on sand aging and its implications for engineering practices. By exploring various methods such as field testing, explosive compaction, NEES Vibroseis testing, and laboratory analysis, the research aims to understand how aging affects soil properties over time. The findings suggest dependencies on testing metrics and propose methodologies for scheduling site-specific evaluations, which could enhance the quality assurance process in geotechnical engineering.

E N D
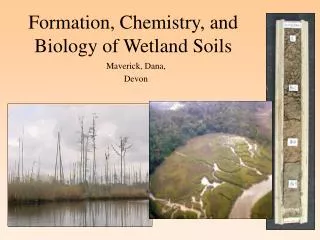
Predicting Future Performance of Improved Soils from Today’s Test Data David A. Saftner, Russell A. Green, & Roman D. Hryciw
Outline • Sand Aging Overview • Field Testing • Explosive Compaction • NEES Vibroseis Testing • Laboratory Testing • Summary
10 15 20 5 0 +4 +2 0 -2 -4 -6 -8 -10 -12 -14 Sand Aging Overview Practical Application CPT qc (MPa) Minimum Allowable qc Level: mPD Pre-vibrocompaction Post-vibrocompaction (~2 weeks after) Post-vibrocompaction (~6 weeks after) (from Debats and Sims 1997)
Sand Aging Overview Proposed Mechanisms: • Mechanical – micro-level particle rearrangement • Chemical – precipitation and cementation • Dissolution of bubbles – blast gas or air • Biological – microorganisms
Sand Aging Overview Methods of dealing with aging: • Scheduling time to allow aging to occur • Site specific aging metrics based on test improvement projects • Several proposed relationships:
Sand Aging Overview Methods of dealing with aging: • Schmertmannet al. (1986) • Based on observations of a dynamic compaction test site prior to main site improvement project
Sand Aging Overview Methods of dealing with aging: • Mesri et al. (1990) (qc)R = tip resistance at a reference time after the end of primary consolidation t = time of aged tip resistance measurement tR = reference time following primary consolidation CD = parameter reflecting densification method C = secondary compression index Cc = compression index
Sand Aging Overview Methods of dealing with aging: • Charlie et al. (1992) K = empirical constant based on the chart N = number of weeks since disturbance
Sand Aging Overview Methods of dealing with aging: • Joshi et al. (1995) Pt, P1 = penetration resistance on tth and 1st day following disturbance, respectively t = aging period in days a, b = constants depending on environmental conditions with average values shown in the table above
Field Testing Paleo-liquefaction features Vibroseis site Blast site
Field Testing Paleo-liquefaction feature
Field Testing Clay 1.5m Upper Liquefiable Layer Loose ~GWT Sand 3m 5m Dense Sand 10m Lower Liquefiable Layer Loose Gravelly Sand 14m
Field Testing Cone Penetration Test Vision Cone Camera Accelerometer Friction Sleeve Pressure Transducer
Explosive Compaction A’ CPTu SCPT DMT VisCPT A CPT Pre-Blast One Week One Month 2.5 Months 20’ 3.5 Months One Year
Explosive Compaction View A-A’ Clay 6.1m (20’) 1.5m Loose ~GWT Sand 3m 5m 0.6m (22.5”) Dense Sand 10m 1.15m (45.9”) Loose Gravelly Sand 12m 0.1m (4.5”) 14m
Explosive Compaction Tip resistance, q (MPa) c 0 5 10 15 20 25 30 35 40 0 Pre-Blast Range (7 tests) One Week Range (6 tests) 2 2.5 Month Range (3 tests) Upper Liquefiable Layer 4 6 8 Depth, z (m) 10 Lower Liquefiable Layer 12 14 16 18 20
Explosive Compaction Tip resistance, q (MPa) c 0 2 4 6 8 10 12 14 1.5 One Week Range (6 tests) One Week Range (6 tests) 2.5 Month Range (3 tests) 2.5 Month Range (3 tests) 2 2.5 3 Depth, z (m) 3.5 4 4.5 5
Explosive Compaction Tip resistance, q (MPa) c 0 2 4 6 8 10 1.5 2 2.5 3 Depth, z (m) 3.5 4 One Week Average (6 tests) 4.5 1 Month Average (3 tests) 2.5 Month Average (3 tests) 1 Year Average (3 tests) 5
NEES Vibroseis SCPT DMT VisCPT CPT 7.5’ Pre-Blast One Week One Month 9 Months
NEES Vibroseis Tip resistance, q (MPa) c 0 5 10 15 20 25 30 35 40 0 Post-shake range (3 tests) One month range (3 tests) 1 2 Upper Liquefiable Layer Upper Liquefiable Layer 3 4 Depth, z (m) Depth, z (m) 5 6 7 8 9 10
NEES Vibroseis Tip resistance, q (MPa) c 0 5 10 15 20 25 30 35 40 0 Pre-shake average (4 tests) Post-shake average (3 tests) 1 One month average (3 tests) One year average (3 tests) 2 Upper Liquefiable Layer 3 4 Depth, z (m) 5 6 7 8 9 10
Summary • Sand aging is important because of dependence on in-situ testing when developing QA metrics • Following explosive compaction, CPT qc and Vs showed time-dependent increases • Following vibroseis shaking, Vs showed slight time-dependent increases but little change to CPT qc
Summary • Comparison of several field disturbance techniques and laboratory testing performed on the same site/soil is unique in aging literature • Synergistic laboratory/field components of this research will allow development of a metric that predicts future in-situ test results using today’s data
Acknowledgements • EERI, FEMA, & NEHRP • NSF & NEES • Professors Jerry Lynch, Richard Woods & Kyle Rollins • Jan Pantolin & YongsubJung • Mulzer Crushed Stone, Inc • Spartan Specialties, Ltd