Download
1 / 17
170 likes | 335 Views
CHAPTER 3 THE CONCEPTUAL PAPER WORKSHEET. To solve the Break-Even Model Through a table of relevant data, finding the answer where PROFIT is exactly zero. Through a graphical representation of the relevant data, finding the answer from the graph.

E N D
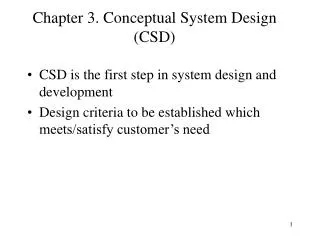
CHAPTER 3 THE CONCEPTUAL PAPER WORKSHEET • To solve the Break-Even Model • Through a table of relevant data, finding the answer where PROFIT is exactly zero. • Through a graphical representation of the relevant data, finding the answer from the graph. • Through a system of linear simultaneous equations, finding the answer by solving the system of linear equations.
CONCEPTUAL PAPER WORKSHEET (CPW) • To highlight the important modelling and package handling issues • The construction of a CPW is useful in three ways : • To clarify any academic modelling issues. • To determine the size of the worksheet and the range of cells that will be used. • To identifies the range of package facilities that will need to be activated in constructing the model through a worksheet.
WHAT IS A WORKSHEET ? • A large two dimensional piece of paper • COLUMNS---LETTER LABELS • ROWS--- NUMBER LABELS • CELL/BOX---combination of COLUMN and ROW • Example Table 3.1 • On WORKSHEET, the user enters instructions that enable the package to perform relevant data manipulations. • Two software packages • The SPREADSHEET package EXCEL • To be controlled through MENUS • The STATISTICAL package MNITAB • To be controlled through COMMANDS
User inputs of CPW • A clear specification of the academic issues (THE THEORETICAL MODEL ) • Is the problem properly defined? • Is the model properly structured? • Are all the variables required specified? • Are the variables of interest properly defined? • Explicit recognition of the package handling facilities(BUILDING A WORKSHEET )
SECTION I: CREATING A TABLE OF DATA • Four inputs into the Break-Even model • SELLING PRICE per unit (p) , • FIXED COSTS (FC) , • VARIABLE COST per unit (VC) , and • RANGE of OUTPUTS • q---quantity to produce • To determine SIZE of the worksheet to be created.
BASIC INPUTS • A1—A23 (Table 3.2) • Cell A9: FORMULA : =A8+10 • '=' means that this cell input is a formula and not a label or a number • COPY the IDEA CONTAINED in A9 INTO A10 and then ALL THE WAY THROUGH TO A23. • TOTAL REVENUE COLUMN • B7—TR • cell B8: FORMULA : =$B$3*A8 • PRICExQUANTITY • $--RELATIVE and an ABSOLUTE CELL ADDRESS. • X is replaced by * • COPY the idea contained in B8 into the cells B9 THROUGH TO B23
TOTAL COST COLUMN • C7—TC • C8: FORMULA : =$B$4+$B$5*A8 • TC = FC + VCq • COPY the idea contained in C8 into the cells C9 THROUGH TO C23 • PROFIT • D7—PROFIT • D8: FORMULA : =B8-C8 • Copy the FORMULA in cell D8 into D9 THROUGH TO D23
FILE HANDLING FACILITIES , • FILE/SAVE • FILE/OPEN • SUMMRY • DATA ENTRY : entering both labels/names and formula • COPYING : to copy a formula to other • FILE HANDLING : to save and retrieve the worksheet
SECTION II: WORKSHEET GRAPHS • What kind of graph is to be constructed? • pie charts, bar graphs , X-Y graph,… • What is to measured along the X-axis? • Q– quantity produced • What is to be measured up the Y-axis? • TR , TC and PROFIT • Labelling the Lines (TR , TC and PROFIT )
Graph Titles • Break-Even Analysis • Scaling of Axes
SECTION III: GENERATING A NUMERICAL SOLUTION • Matrix A and Matrix b • E1—E4: TR • F1—F4: TC • G1—G4: q • Matrix A is in the range E2 to G4
H1—H4: RHS • Matrix b is in the range H2 to H4 • Where to put the answer? • J1—J4: ANSWER • To generate the answer by the following steps: • inform the package as to the whereabouts of the matrix A. • inform the package that we would like to form the inverse of A , A-1.
inform the package where in the spreadsheet we would like to store the inverse matrix A-1 • inform the package as to the whereabouts of the matrix b • inform the package that we would like to perform the multiplication A-1b • inform the package where we would like the answer to be displayed