Download
1 / 54
540 likes | 663 Views
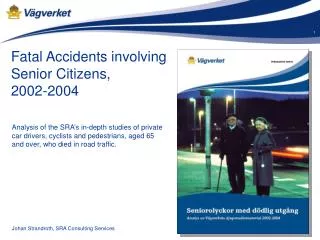
Fatal Accidents involving Senior Citizens, 2002-2004. Analysis of the SRA’s in-depth studies of private car drivers, cyclists and pedestrians, aged 65 and over, who died in road traffic. Johan Strandroth, SRA Consulting Services. In-depth studies.

E N D
Fatal Accidents involving Senior Citizens, 2002-2004 Analysis of the SRA’s in-depth studies of private car drivers, cyclists and pedestrians, aged 65 and over, who died in road traffic. Johan Strandroth, SRA Consulting Services
In-depth studies • Police – background information and traffic case notes • Forensic medicine - autopsy reports • Technical examination of vehicles • Emergency services – callout report • SRA – collision report • Excerpts from the national driving licence and vehicle registry In-depth study of road deaths amongst people aged 65 and over, 2002-2004
List of contents Cyclists slides 41-47 Accident trends 42-43 Other party 44 Traffic environment 45-46 Helmet use 47 Pedestrians slides 48-54 Accident trends 49-50 Other party 51 Traffic environment 52-54 Generalslides 3-20 Accident trends 4-5 Road user category 6-9 Time 12-13 Light conditions 14-15 Age 16-17 Gender 18-19 Cause of death 20-21 Alcohol 22-23 Posted speed limit 24-25 Own or other’s mistake 26-27 Road manager 28 Cars slides 29-40 Accident trends 30-31 Type of accident 32-33 Seat belt use 34 Estimated speed 35 Other party 36 Risk of the driver injuring or killing a pedestrian or cyclist 37 Vehicle age 38-39 Safety class 40 In-depth study of road deaths amongst people aged 65 and over, 2002-2004
Accident trends Number of seniors killed in traffic, 1996-2005 In recent years, about 120 seniors were killed in traffic every year. Every fourth road death is a senior citizen. In-depth study of road deaths amongst people aged 65 and over, 2002-2004
Accident trends Number of seniors seriously injured in traffic, 1996-2005 In recent years about 450 seniors were seriously injured in traffic every year.Every ninth person seriously injured in traffic is a senior citizen. In-depth study of road deaths amongst people aged 65 and over, 2002-2004
Road user category Percentage who died Only pedestrians hit by a vehicle. Most seniors who die in traffic are killed in cars, and they are over-represented in cyclist and pedestrian road fatalities. In-depth study of road deaths amongst people aged 65 and over, 2002-2004
Road user category Percentage seriously injured* * Strada health care data 2003 Most seniors seriously injured in traffic are pedestrians, and they are heavily over-represented in serious pedestrian accidents. In-depth study of road deaths amongst people aged 65 and over, 2002-2004
Road user category Percentage slightly injured* * Strada health care data 2003 Most seniors slightly injured in traffic are pedestrians, and they are heavily over-represented in less serious pedestrian accidents. In-depth study of road deaths amongst people aged 65 and over, 2002-2004
Road user category Percentage fatalities and vehicle mileage, 2001-2005 Almost half of all cyclists and pedestrians as well as every fifth driverkilled in traffic are seniors. Seniors account for only about 10% of the vehicle mileage in these categories. In-depth study of road deaths amongst people aged 65 and over, 2002-2004
Selected case studies 281 seniors died in 262 accidents Natural death, 56 Suicide, 5 219 fatalities in 200 accidents Dropout, 52 accidents Homicide, 1 Material analysed in more depth: 219 fatalities in 200 accidents. In-depth study of road deaths amongst people aged 65 and over, 2002-2004
Selected case studies 281 seniors died in 262 accidents 3 100 50 26 Car drivers 33 5 10 Cyclists 1 1 67 16 Pedestrians 2 It was found that over every fourth car driver killed in traffic died a natural death. In-depth study of road deaths amongst people aged 65 and over, 2002-2004
Time - Month 200 accidents, percentage The percentage of seniors involved in fatal accidents is twice that of other road users in December. In-depth study of road deaths amongst people aged 65 and over, 2002-2004
Time - Month 200 accidents – Car drivers, Cyclists and Pedestrians Pedestrian fatalities occur primarily in the winter, and cyclist fatalities in the summer. Fatalities amongst car drivers are spread more evenly throughout the year. In-depth study of road deaths amongst people aged 65 and over, 2002-2004
Light conditions 200 accidents Every fourth fatality involving a senior citizen occurs at night. In-depth study of road deaths amongst people aged 65 and over, 2002-2004
Light conditions 200 accidents – Car drivers, Cyclists and Pedestrians Car drivers Cyclists Pedestrians ca 15% cycling in the dark * Almost 20% walking in the dark* Source: TSU 92-, VTI Older pedestrians are over-represented in fatalities that occur during darkness. In-depth study of road deaths amongst people aged 65 and over, 2002-2004
Age 256 accidents (including natural death) %-age killed %-age vehicle mileage The risk of dying in traffic increases with age. The number of seniors killed in traffic who died a natural death is spread relatively evenly within the 65-89 age category. In-depth study of road deaths amongst people aged 65 and over, 2002-2004
Age 200 accidents – Car drivers, Cyclists and Pedestrians The risk of being killed as a car driver, cyclist or pedestrian increases with age. In-depth study of road deaths amongst people aged 65 and over, 2002-2004
Gender 200 accidents Three of four seniors killed in traffic were men. In-depth study of road deaths amongst people aged 65 and over, 2002-2004
Gender 200 accidents – Car drivers, Cyclists and Pedestrians Men are killed in traffic to a considerably greater extent than women as drivers and cyclists. In-depth study of road deaths amongst people aged 65 and over, 2002-2004
Cause of death 209 fatal injuries* for 200 seniors *Indicate the part of the body subjected to the fatal collision force. Skull and chest injuries are the most common cause of death in traffic for seniors. In-depth study of road deaths amongst people aged 65 and over, 2002-2004
Cause of death 209 fatal injuries for 200 seniors A skull injury is the most common cause of traffic death for cyclists and pedestrians. A chest injury is the most common cause of traffic death for drivers. In-depth study of road deaths amongst people aged 65 and over, 2002-2004
Alcohol 200 accidents %-age of alcohol or drug-related * accidents for all age categories is one in four, according to ”In-depth studies of fatal collisions in southern Sweden 1997-2002”. * Alcohol-related means that one of the active parties in an accident was under the influence. Seniors die in alcohol-related traffic accidentsto a lesser extent than other age categories. In-depth study of road deaths amongst people aged 65 and over, 2002-2004
Alcohol 200 accidents – Car drivers, Cyclists and Pedestrians 5% 9% 7% 93% 95% 91% Car drivers Cyclists Pedestrians Every 20th car driver killed in traffic was under the influence of alcohol. In-depth study of road deaths amongst people aged 65 and over, 2002-2004
Posted speed limit 200 accidents, percentage Seniors are clearly over-represented in traffic environments where the speed limit is 50 km/h compared to other road users. In-depth study of road deaths amongst people aged 65 and over, 2002-2004
Posted speed limit 200 accidents, percentage – Car drivers, Cyclists and Pedestrians Older pedestrians are killed in traffic most often where the speed limit is 50 km/hand represent a larger proportion than other road users. In-depth study of road deaths amongst people aged 65 and over, 2002-2004
Own or other’s mistake 200 accidents Percentage killed through their own mistake in all age categories is 54%. Source: In-depth studies of fatal collisions in southern Sweden, 1997-2000 Seniors are killed in traffic more often than others through their own mistake. In-depth study of road deaths amongst people aged 65 and over, 2002-2004
Own or other’s mistake 200 accidents – Car drivers, Cyclists and Pedestrians Car drivers Cyclists Pedestrians Source: TSU 92-, VTI Older cyclists and car drivers are killed in traffic to a greater extent than older pedestriansas a result of their own mistake. In-depth study of road deaths amongst people aged 65 and over, 2002-2004
Road manager 200 accidents, number Nine of ten car drivers were killed on the state road network. In-depth study of road deaths amongst people aged 65 and over, 2002-2004
Car drivers 100 seniors killed in traffic 2002-2004 In-depth study of road deaths amongst people aged 65 and over, 2002-2004
Private passenger cars – Accident trends Car drivers killed in traffic, 1996-2005 In recent years, about 50 seniors were killed a year when driving a car. Every fifth car driver killed in traffic was a senior citizen. In-depth study of road deaths amongst people aged 65 and over, 2002-2004
Private passenger cars – Accident trends Seriously injured car drivers, 1996-2004 In recent years, about 180 seniors were seriously injured in traffic a year when driving a car. Every ninth car driver who was seriously injured was a senior citizen. In-depth study of road deaths amongst people aged 65 and over, 2002-2004
Private passenger cars – Type of accident 100 accidents, percentage Compared to other road users, seniors are over-represented in accidents at intersections and in rear-end collisions but under-represented in single accidents. In-depth study of road deaths amongst people aged 65 and over, 2002-2004
80% 0% 20% Private passenger cars – Intersection 41 accidents, percentage Eight of ten seniors who were killed at intersections drove out in front of another car.No older car driver was killed in a roundabout. In-depth study of road deaths amongst people aged 65 and over, 2002-2004
Private passenger cars – Seat belt use 100 accidents Unknown, 5% Without seat belt, 24% 9 of 24 would have survived with a seat belt Number not wearing a seat belt for all age categories is 4 of 10, according to ”In-depth studies of fatal collisions in southern Sweden, 1997-2002 With seat belt, 71% Every fourth senior killed was not wearing a seat belt. More than every third of these would probably have survived if they had worn a seat belt. In-depth study of road deaths amongst people aged 65 and over, 2002-2004
Private passenger cars – Estimated speed 100 accidents Unknown, 3% Posted, 87% Much above, 3% Above, 2% Posted = max 10 km/h above the posted speed limit Above= max 30 km/h above the posted speed limit Much above = more than 30 km/h above the posted speed limit It seems that only every 20th driver had been driving above the posted speed limit. In-depth study of road deaths amongst people aged 65 and over, 2002-2004
Private passenger cars – Other party 80 accidents in collision with another vehicle, number Half of the car collisions involved another car, and a third involved a lorry. In-depth study of road deaths amongst people aged 65 and over, 2002-2004
Private passenger cars - Risk of the driver injuring or killing a pedestrian or cyclist Source: Strada police data 2005, VTI Older and younger car drivers run from 1.5 to twice as high a risk of injuring pedestrians or cyclists compared to drivers in the 30-64 year age category. In-depth study of road deaths amongst people aged 65 and over, 2002-2004
Private passenger cars – Model year 100 accidents, percentage Seven of ten car drivers died in cars that were eight years old or older. In-depth study of road deaths amongst people aged 65 and over, 2002-2004
Private passenger cars – Age of car versus age of owner Killed, slightly or seriously injured More drivers older than 65 are injured in older cars compared to other drivers. In-depth study of road deaths amongst people aged 65 and over, 2002-2004
Private passenger cars – Safety class 100 cars classified according to ”How safe is your car?” published by the Folksam Insurance Company Every third car driver was killed in a car less safe than the average car. In-depth study of road deaths amongst people aged 65 and over, 2002-2004
Cyclists 33 seniors killed in traffic 2002-2004 In-depth study of road deaths amongst people aged 65 and over, 2002-2004
Cyclists – Accident trends Cyclists killed, 1996-2005 In recent years, about 15 seniors were killed every year when riding bicylces. Half of all cyclists killed were seniors. In-depth study of road deaths amongst people aged 65 and over, 2002-2004
Cyclists – Accident trends Seriously injured cyclists, 1996-2004 In recent years about 60 senior cyclists were seriously injured per year.Every seventh seriously injuredcyclist was a senior citizen. In-depth study of road deaths amongst people aged 65 and over, 2002-2004
Cyclists – Other party 33 accidents, number Collision with a car is the most common cause of fatal bicycle accidents. In-depth study of road deaths amongst people aged 65 and over, 2002-2004
Cyclists – Traffic environment 33 accidents, percentage Most seniors are killed on bikes in urban areas, but the risk of being killed while cycling is greatest on rural roads. In-depth study of road deaths amongst people aged 65 and over, 2002-2004
Cyclists – Traffic environment 12 accidents on rural roads 8 accidents 4 accidents Eight of twelve cycle accidents on rural roads occurred in connection with a left turn. In-depth study of road deaths amongst people aged 65 and over, 2002-2004
Cyclists – Helmet use 33 accidents Unknown, 6% With helmet, 6 % No helmet, 88% Would probably have survived with a helmet, Nine of ten cyclists killed were not wearing a helmet. Almost half of these would probably have survived with a helmet. In-depth study of road deaths amongst people aged 65 and over, 2002-2004
Pedestrians 67 seniors killed in traffic 2002-2004 In-depth study of road deaths amongst people aged 65 and over, 2002-2004
Pedestrians – Accident trends Pedestrians killed, 1996-2005 In recent years about 25 senior pedestrians were killed every year. Almost half of all pedestrians killed were seniors. In-depth study of road deaths amongst people aged 65 and over, 2002-2004
Pedestrians – Accident trends Seriously injured pedestrians, 1996-2004 In recent years about 90 senior pedestrians were seriously injured every year.Every fourth pedestrian who was seriously injured was a senior citizen. In-depth study of road deaths amongst people aged 65 and over, 2002-2004