Chapter 4: Variability
Chapter 4: Variability. Variability. The goal for variability is to obtain a measure of how spread out the scores are in a distribution. A measure of variability usually accompanies a measure of central tendency as basic descriptive statistics for a set of scores. .

Chapter 4: Variability
E N D
Presentation Transcript
Variability • The goal for variability is to obtain a measure of how spread out the scores are in a distribution. • A measure of variability usually accompanies a measure of central tendency as basic descriptive statistics for a set of scores.
Central Tendency and Variability • Central tendency describes the central point of the distribution, and variability describes how the scores are scattered around that central point. • Together, central tendency and variability are the two primary values that are used to describe a distribution of scores.
Variability • Variability serves both as a descriptive measure and as an important component of most inferential statistics. • As a descriptive statistic, variability measures the degree to which the scores are spread out or clustered together in a distribution. • In the context of inferential statistics, variability provides a measure of how accurately any individual score or sample represents the entire population.
Variability (cont.) • When the population variability is small, all of the scores are clustered close together and any individual score or sample will necessarily provide a good representation of the entire set. • On the other hand, when variability is large and scores are widely spread, it is easy for one or two extreme scores to give a distorted picture of the general population.
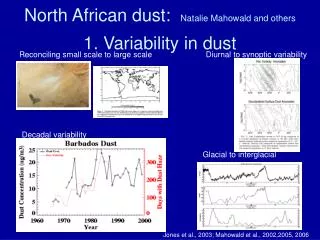
Measuring Variability • Variability can be measured with • the range • the interquartile range • the standard deviation/variance. • In each case, variability is determined by measuring distance.
The Range • The range is the total distance covered by the distribution, from the highest score to the lowest score (using the upper and lower real limits of the range). • Range = URL for Xmax – LRL for Xmin • For discrete variables, add 1 to formula. • Alternative, difference between largest and smallest score without reference to real limits. Many computer programs use this. • Not a great measure of variability because extreme scores have too much impact.
The Interquartile Range • The interquartile range is the distance covered by the middle 50% of the distribution (the difference between Q1 and Q3).
The Standard Deviation • Standard deviation measures the standard distance between a score and the mean. • The calculation of standard deviation can be summarized as a four-step process:
The Standard Deviation (cont.) 1. Compute the deviation (distance from the mean) for each score. What will the mean of the deviation scores equal? 2. Square each deviation. 3. Compute the mean of the squared deviations. For a population, this involves summing the squared deviations (sum of squares, SS) and then dividing by N. The resulting value is called the variance or mean squared deviationand measures the average squared distance from the mean. For samples, variance is computed by dividing the sum of the squared deviations (SS) by n - 1, rather than N. The value, n - 1, is known as degrees of freedom (df) and is used so that the sample variance will provide an unbiased estimate of the population variance. 4. Finally, take the square root of the variance to obtain the standard deviation. (Standard or average distance from the mean).
Properties of the Standard Deviation • If a constant is added to every score in a distribution, the standard deviation will not be changed. • If you visualize the scores in a frequency distribution histogram, then adding a constant will move each score so that the entire distribution is shifted to a new location. • The center of the distribution (the mean) changes, but the standard deviation remains the same.
Properties of the Standard Deviation (cont.) • If each score is multiplied by a constant, the standard deviation will be multiplied by the same constant. • Multiplying by a constant will multiply the distance between scores, and because the standard deviation is a measure of distance, it will also be multiplied. • Used for scores on interval or ratio scales only.
The Mean and Standard Deviation as Descriptive Statistics • If you are given numerical values for the mean and the standard deviation, you should be able to construct a visual image (or a sketch) of the distribution of scores. • As a general rule, about 70% of the scores will be within one standard deviation of the mean, and about 95% of the scores will be within a distance of two standard deviations of the mean.
Formulas • Sum of squared deviations (SS) – the sum of the squared deviation scores – generally called sum of squares • Variance = mean squared deviation = SS/n • Definitional formula - SS = ∑(X-μ)2 • Computational formula • SS = ∑X2 – (∑X)2 / N • Population variance = SS/N • Standard Deviation = √SS/N
Formulas (cont) • Population standard deviation • σ = √σ2 = √SS/N • Population variance • σ2 = SS/N
SD and Variance for Samples • Samples tend to be less variable than the population • Results in biased estimate of population variability • Notation changes: • M for μ • n for N • s2 for σ2 and s for σ • Instead of dividing by N, divide by n - 1
Sample Formulas • Sum of squared deviations (SS) • Definitional formula - SS = ∑(X-M)2 • Computational formula • SS = ∑X2 – (∑X)2 / n • Sample variance = s2 = SS/n-1 • Sample standard deviation • s = √s2 = √SS/n-1 • Sample variance • s2 = SS/n-1
Degrees of Freedom • For a sample of n scores, the degrees of freedom, of df, is defined as df = n – 1. • Degrees of freedom determine the number of scores in the sample that are independent and free to vary. • Designed to provide an unbiased estimate of the population parameter. • Unbiased if average value of statistic (from all possible samples) is equal to the population parameter.