Multivariate Time-Series Analysis: Enhancing Visualization and Personalization in Clinical Data
360 likes | 507 Views
This dissertation explores multivariate time-series analysis for physiological and clinical data, addressing limitations in traditional data visualization methods used in hospitals. With advancements in technology, it presents a novel framework that incorporates personalized metrics for patient care, considers inconsistencies in time scales, and addresses data overload in the ICU. The proposed Multivariate Time-Series Amalgam (MTSA) visualization captures essential medical events while allowing clinicians to track patients' progress over time effectively, integrating various health parameters for improved decision-making and outcomes.

Multivariate Time-Series Analysis: Enhancing Visualization and Personalization in Clinical Data
E N D
Presentation Transcript
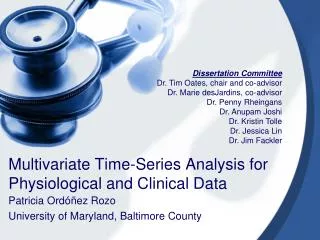
Dissertation Committee Dr. Tim Oates, chair and co-advisor Dr. Marie desJardins, co-advisor Dr. Penny Rheingans Dr. Anupam Joshi Dr. Kristin Tolle Dr. Jessica Lin Dr. Jim Fackler Multivariate Time-Series Analysis for Physiological and Clinical Data Patricia OrdóñezRozo University of Maryland, Baltimore County
Overview No PDA Severe PDA
Technological Advances in Medicine • 15-350 vital sign and lab results per patient (physiological and clinical data) • Archaic methods of data visualization and analysis in hospitals although they exist…
Tabular Displays Motivation
Univariate Visualization • Inconsistent time scale Motivation
Limited Multivariate Visualization • One scale for everyone, no time values Motivation
Personalization of Medicine • Measurement of well-being in ICU • Physiological and clinical measurements • Age dependent – are you over 15? • Preset thresholds and baselines can be misleading • Need for automated personalization of baselines and thresholds – EMR makes possible Motivation
Information Overload in ICU • Sophisticated methods for gathering data • Tools for analyzing data from multivariate perspective non-existent • Tools for multivariate visualization non-existent • Huge repositories of historical patient data = gold mine for data mining Motivation
Multivariate Metrics in the ICU • Pediatric Risk of Mortality (PRISM) score • Measured within 8 hours of admittance • 14 variables • Acute Physiology and Chronic Health Evaluation II (APACHE II) score • Measured within 24 hours of admittance • 12 variables Motivation
Inspirations for this work • Wavelet-based symbolic representation by Saeed and Mark at Harvard-MIT • Used to compare medical multivariate time series data at different levels of granularity • Novel similarity metric • Symbolic Aggregate Approximation (SAX) by Lin and Keogh at UC Riverside • Symbolic representation of time series • Used to find anomalies and patterns in univariate data Background
c c c b b b a a - - 0 0 40 60 80 100 120 20 What is SAX? C First convert the time series to PAA representation. C 0 20 40 60 80 100 120 Then convert the PAA to SAX symbols. ⅓ ⅓ ⅓ baabccbc Thanks to Eamonn Keogh and Jessica Lin for use of slide Background
Work of Saeed and Mark • AMIA 2006 Symposium • Similar multi-parameter physiological time series using wavelet-based symbolic representation at different levels of granularity • Used HR, SBP and cardiac output to predict hemodynamic deterioration Haar Basis Functions Background
Creation of Vector Space Model Background
Creation of Novel Similarity Metric • Used modified information retrieval methods for finding similar time series • Term Frequency (TF) TF = # words in document)/ # of words in document • Inverse Document Frequency (IDF) IDF = log(# of documents/frequency(word in all documents)) Ignored temporal patterns Emphasized multi-scale analysis Background
Bag-of-Patterns Representation • Lin and Li • SSDBM 2009 Thanks to Jessica Lin for use of these images Background
Proposed Solution • Create a multivariate time-series representation that • can capture medically significant events such as organ failure and • is personalized. Multivariate Time Series Amalgam (MTSA) Proposed Solution
Proposed Solution • Create a visualization that can • capture the rate of change in variables, • display their relationships over time, and • assist providers in evaluating a patient’s progress. MTSA Visualization Proposed Solution
Key Challenge with MTSA • MTSA must represent • Patient’s baseline • Standard threshold • Two-tier representation • Three views Current Work
Creating an MTSA • Interpolated to fill missing values • Normalized individual univariate time series • Interleaved values for each interval • Overlapped the intervals in the visualization. Current Work
Creating an MTSA • Interpolated to fill missing values • Normalized individual univariate time series as in SAX (HRactual– HRaverage)/ σHR Or • (HRactual– HRtarget)/ HRrange • Interleaved values for each interval • Overlapped the intervals in the visualization. Current Work
Creating an MTSA • Normalized individual univariate time series • Interpolated to fill missing values • Interleaved values for each interval • Cardiac (HR,SBP, DBP) • Pulmonary (RR, pCO2) • Renal (CO2, Crea, BUN, NA) • Liver (NH3, Bilirubin) • Other (WBC, Core Temp, Hct) • Overlapped the intervals in the visualization. Na Current Work
Creating an MTSA • Interpolated to fill missing values • Normalized individual univariate time series • Interleaved values for each instance • Overlapped the intervals for the visualization. Current Work
Key Challenge with Visualization • Capture relevant temporal patterns • Correlations between variables • Trends over time • Toggle between three views of two representation of the data • personalized • standard • customized • Incorporate parameter-specific scaling Current Work
Multivariate Time-Series Amalgam (MTSA) Visualization Demo Current Work
Pilot Study • Asked 14 residents at St. Agnes Hospital to predict whether the 10 patients went into an episode of acute hypotension • Each used tables and visualization for five patients
Results of the Pilot Study Accuracy with Tables 57.5% Accuracy with Visualization 52.2% Physionet Challenge 2009 28 submissions 13 had 100% accuracy 9 had 80% accuracy 5 had 60% accuracy 1 had 20% accuracy
Proposed Solution • Develop a similarity metric for the representation in order to • accurately predict the onset of specific medical events in a timely, multivariate fashion. Proposed Solution
Proposed Solution • Develop a similarity-based retrieval method to • input a patient’s physiological and clinical data and • retrieve patients from large databases who • are physiologically similar and • have experienced similar medical events. Proposed Solution
Key Challenge with Similarity • Dealing with variations between patients who are similar • different total amount of data • similar changes that occur over different time periods • Create a multivariate version of BOP • The state of a patient at a particular time (MTSA) = a word • Use modified information retrieval methods of TF and IDF for similarity metric Current Work
Proposed Similarity Metric • Multivariate BOP that crosses the time series HR BCCBBACB RR AABAABAB BACB,CACB,… DeltaBP CCBACCBA MAP BBBBBBBB Histogram of word frequencies using a modified form of TF/IDF incorporating personalized and standard representations Current Work
Frequency of MTSAs Current Work
TF/IDF • Xi = MTSA word • N = # patients • M = # words in MTSA vocabulary = (# letters in alphabet)# params TF(xi) = fpatient j(xi) / ∑i = 1→M fpatient j(xi) IDF(xi) = log (N / (1 + fN(xi))) FVpatient j = [TF(x1) * IDF(x1) , …. , TF(xM) * IDF(xM)] Current Work
Considerations • Are we using the right parameters? • Should we use data gathered at higher frequency? • Do we compare different levels of granularity? • Do we incorporate the standard representation in the similarity metric? Current Work
Summary • We have created a multivariate time-series representation of a patient’s physiological and clinical that • is personalized, • can be visualized, and • may be used to find physiologically similar patients who have experienced like events, • may be used to retrieve “similar” patients from large databases of electronic medical records.
Future Work • Real-time remote visualization • Study on the visualization to determine effectiveness in diagnosing PDA • Incorporate analytics into visualization • Similarity metric • How similar is a patient to other patients with a specified condition? • Information retrieval • What types of patients is this patient similar to?
Acknowledgements • Advisors • Drs. Tim Oates and Marie desJardins(Computer Science) • Dr. Jim Fackler (Medicine) • Committee • Drs. Anupam, Rheingans, Tolle, and Lin • Advocates/Mentors • Drs. Wendy Carter, Michael Grasso, ChristophU. Lehmann, Roger Mark, Jessica Lin, Eamonn Keogh, Daniel J. Scott, Janet Rutledge, RenettaTull, Jorge H. Ordóñez-Smith • Maple, Coral and eBiquity lab mates and classmates • National Science Foundation