Download
1 / 16
160 likes | 291 Views
Hidden benefits of light rail systems in the urban transport network. dr. ir. N. van Oort Assistant professor public transport. Meeting Rotterdam/The Hague 2014. Resume. Research agenda Optimizing public transport Network, timetables and operations Three key aspects:

E N D
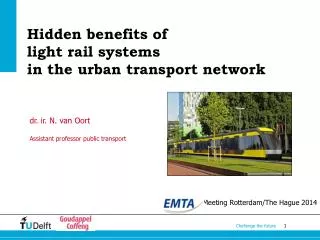
Hidden benefits of light rail systems in the urban transport network dr. ir. N. van Oort Assistant professor public transport Meeting Rotterdam/The Hague 2014
Resume • Research agenda • Optimizing public transport • Network, timetables and operations • Three key aspects: • Vehicle -> Passengers • Trip -> journey • Costs -> benefits • Data driven research • Light rail • Planning and decision making • Optimization of planning and operations • Success and failure aspects in NL • Analysis of projects in NL • Book in 2015, in cooperation with Dr. Rob vd Bijl
Outline Increasing quality and ridership of public transport services Light rail combines strengths of several systems (train, tram, metro) Service reliability is key quality aspect Potential impacts? Decision making? Two cases: • Light rail operations: RandstadRail The Hague • Light rail planning: New tram line Utrecht
RandstadRail: The Hague About 95.000 passengers per day Two lines; 33 and 27 km | 41 and 31 stops 5 min headway per line per direction
Focus on service reliability • High level of quality and reliability • In urban area • Poor punctuality • Poor regularity • High number of vehicles per hour per direction (>24) • Signalling applied: limited capacity • Shared tracks with tram and metro • Operational targets of transit authority
Main elements • Preventing unplanned stopping • Punctuality • Dwelling (vehicles and stops) • Timetable • Dispatching room
Actual effects • Average dwell time 28 s 24 s • Standard deviation - 70% • Average delay 90 s 20 s • Departure punctuality: 70% 93% <-1,+1> • Driving ahead of schedule: 50%7% <,0> • Customer satisfaction: 6.7->7.4 • Ridership growth: ~30%
Conclusions • RandstadRail: High frequent light rail in an urban area • High reliability because of controlling operations • Ridership growth due to substantial quality leap • How to incorporate quality improvements in decision making and planning?
Decision making in public transport • Most projects aim at enhanced reliability • Service reliability is often missing in CBA and transport models • We developed: • Methodology to incorporate passenger impacts of service reliability: • Transport models (reliable forecasts) • Cost benefit analyses • Applied in Utrecht
Case: Uithoflijn (line 12) Central Station City of Utrecht “De Uithof” - University - Hospital Utrecht - Centrally located in the Netherlands • 4th largest city • 300.000 inhabitants
Problem analysis • Busiest bus line in the Netherlands: 27.000 passengers per day • Frequency of 23x/hour/direction using double-articulated buses: 30x/hour/direction necessary • Mobility is still growing • +25% planned property in the Uithof: +8000 students, +10.000 employees • Total: 53.000 students, 30.000 employees and 3.500 visitors (hospital) • No additional parking space • Demand forecast: 46.000 passenger per day Solution • Introduction of a light rail line: 16-20x/hour
Ministry requires CBA Regional parties agreed with plans and finances €110 million of Minister of Transport available (about 1/3 of total costs) CBA > 1,0 NO YES +
Our approach Calculations of: Future demand, including tram bonus impacts Costs (infrastructure and operations) Benefits Travel time gains Reliability gains
Results CBA Additional waiting time due to unreliability Distribution of travel time due to unreliability Service reliability effects are over >60% of all benefits! This method was approved by the Dutch Ministry and the Minister provided the €110 million
Conclusions Service reliability is important quality aspect of public transport Light rail enables increase in service realibility and higher ridership Little attention to service reliability in cost-benefit analyses Research and case proves: It is possible to quantify service reliability and calculate the monetary value Service reliability benefits made the difference Service reliability needs more attention in both planning and decision making
Questions / Contact Niels van Oort N.vanOort@TUDelft.nl Papers: https://nielsvanoort.weblog.tudelft.nl/ UITP Magazine International Railway Journal