Download
1 / 3
0 likes | 28 Views
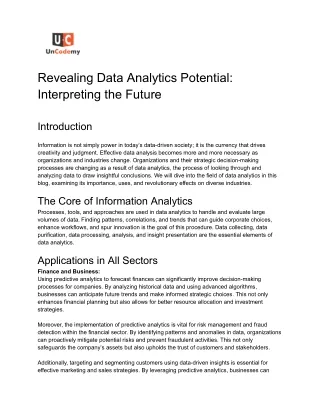
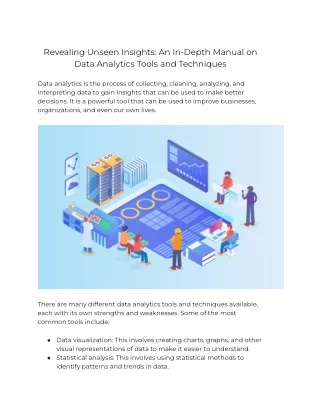
Data analytics is the process of collecting, cleaning, analyzing, and interpreting data to gain insights that can be used to make better decisions. It is a powerful tool that can be used to improve businesses, organizations, and even our own lives.<br>

E N D
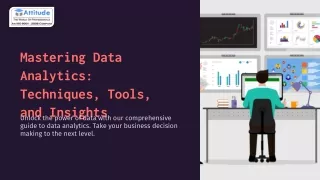
Revealing Unseen Insights: An In-Depth Manual on Data Analytics Tools and Techniques Data analytics is the process of collecting, cleaning, analyzing, and interpreting data to gain insights that can be used to make better decisions. It is a powerful tool that can be used to improve businesses, organizations, and even our own lives. There are many different data analytics tools and techniques available, each with its own strengths and weaknesses. Some of the most common tools include: ● Data visualization: This involves creating charts, graphs, and other visual representations of data to make it easier to understand. ● Statistical analysis: This involves using statistical methods to identify patterns and trends in data.
● Machine learning: This involves using algorithms to learn from data and make predictions. ● Natural language processing: This involves using algorithms to analyze text data. The best data analytics tool or technique for a particular situation will depend on the specific goals of the analysis. For example, if you are trying to identify patterns in customer behavior, you might use data visualization or statistical analysis. If you are trying to build a model to predict future sales, you might use machine learning. In this blog post, we will provide an in-depth overview of the most common data analytics tools and techniques. We will also discuss the steps involved in conducting a data analytics project, from data collection to interpretation. The Steps of a Data Analytics Project A data analytics project typically follows these steps: 1. Define the problem. What are you trying to achieve with your data analysis? What are your specific goals? 2. Collect the data. This may involve gathering data from internal sources, such as customer records or sales data, or from external sources, such as social media data or government datasets. 3. Clean the data. This involves removing any errors or inconsistencies in the data. 4. Analyze the data. This is where you use the data analytics tools and techniques to identify patterns and trends. 5. Interpret the results. This involves making sense of the findings and drawing conclusions. 6. Communicate the results. This involves sharing your findings with the stakeholders who need to know. Data Analytics Tools and Techniques Here is a brief overview of some of the most common data analytics tools and techniques:
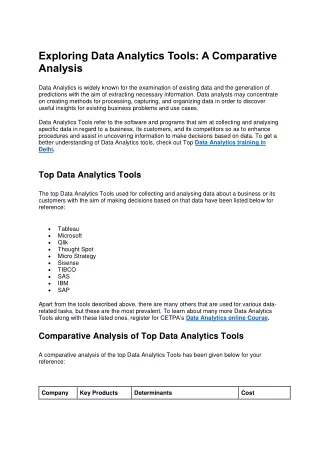
● Data visualization: This involves creating charts, graphs, and other visual representations of data to make it easier to understand. Some popular data visualization tools include Tableau, QlikView, and Microsoft Power BI. ● Statistical analysis: This involves using statistical methods to identify patterns and trends in data. Some popular statistical analysis tools include SPSS, SAS, and R. ● Machine learning: This involves using algorithms to learn from data and make predictions. Some popular machine learning tools include TensorFlow, scikit-learn, and Keras. ● Natural language processing: This involves using algorithms to analyze text data. Some popular natural language processing tools include spaCy, NLTK, and Stanford CoreNLP. Conclusion Data analytics is a powerful tool that can be used to reveal unseen insights. By understanding the different tools and techniques available, you can choose the right ones for your specific needs. And by following the steps involved in a data analytics project, you can ensure that your analysis is successful. I hope this blog post has been helpful. If you have any questions, please feel free to leave a comment below.