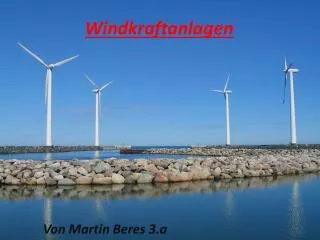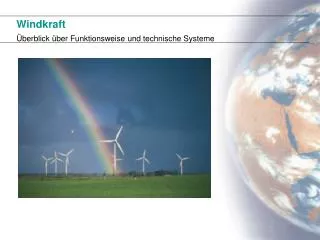
Windkraft
Windkraft. Nutzung Funktionsweise Vor- und Nachteile. Mechanische Energie. Elektrische Energie. Nutzung. Funktionsweise. Funktionsweise. Installierte Leistung in Deutschland nach Bundesländern. Bundesländer alphabetisch . Anzahl WEA 1. Leistung in MW 1.

Windkraft
E N D
Presentation Transcript
Windkraft Nutzung Funktionsweise Vor- und Nachteile
Mechanische Energie Elektrische Energie Nutzung
Installierte Leistung in Deutschland nach Bundesländern Bundesländer alphabetisch Anzahl WEA1 Leistung in MW1 Anteil amNettostrom-verbrauch in %2 Baden-Württemberg 338 387 0,47 Bayern 297 343 0,64 Berlin 0 0 0 Brandenburg 2364 3240 29,14 Bremen 50 58 2,12 Hamburg 59 35 0,40 Hessen 542 462 1,90 Mecklenburg-Vorpommern 1210 1289 34,67 Niedersachsen 4772 5465 19,72 Nordrhein-Westfalen 2491 2464 3,23 Rheinland-Pfalz 915 1076 6,10 Saarland 60 68 1,29 Sachsen 750 820 7,12 Sachsen-Anhalt 1930 2695 38,97 Schleswig-Holstein 2626 2430 36,22 Thüringen 527 649 10,51 Deutschland gesamt 18.931 21.482 7,27
Keine Klima-Beeinträchtigung Platzverbrauch Niedriger Energie-umsetzungs-grad • Kein Co2 Ausstoß
Quellen: http:// de.wikipedia.orghttp://www.hamburger-bildungsserver.de