Phylip
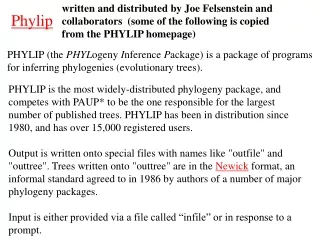
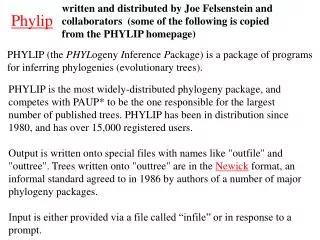
written and distributed by Joe Felsenstein and collaborators (some of the following is copied from the PHYLIP homepage). Phylip. PHYLIP (the PHYL ogeny I nference P ackage) is a package of programs for inferring phylogenies (evolutionary trees).

Phylip
E N D
Presentation Transcript
written and distributed by Joe Felsenstein and collaborators (some of the following is copied from the PHYLIP homepage) Phylip PHYLIP (the PHYLogeny Inference Package) is a package of programs for inferring phylogenies (evolutionary trees). PHYLIP is the most widely-distributed phylogeny package, and competes with PAUP* to be the one responsible for the largest number of published trees. PHYLIP has been in distribution since 1980, and has over 15,000 registered users. Output is written onto special files with names like "outfile" and "outtree". Trees written onto "outtree" are in the Newick format, an informal standard agreed to in 1986 by authors of a number of major phylogeny packages. Input is either provided via a file called “infile” or in response to a prompt.
What’s in PHYLIP Programs in PHYLIP allow to do parsimony, distance matrix, and likelihood methods, including bootstrapping and consensus trees. Data types that can be handled include molecular sequences, gene frequencies, restriction sites and fragments, distance matrices, and discrete characters. Phylip works well with protein and nucleotide sequences Many other programs mimic the style of PHYLIP programs. (e.g. TREEPUZZLE, phyml, protml) Many other packages use PHYIP programs in their inner workings (e.g., PHYLO_WIN) PHYLIP runs under all operating systems Web interfaces are available
Programs in PHYLIP are Modular For example: SEQBOOT take one set of aligned sequences and writes out a file containing bootstrap samples. PROTDIST takes a aligned sequences (one or many sets) and calculates distance matices (one or many) FITCH (or NEIGHBOR) calculate best fitting or neighbor joining trees from one or many distance matrices CONSENSE takes many trees and returns a consensus tree …. modules are available to draw trees as well, but often people use treeview or njplot
is an excellent source of information. The Phylip Manual Brief one line descriptions of the programs are here The easiest way to run PHYLIP programs is via a command line menu (similar to clustalw). The program is invoked through clicking on an icon, or by typing the program name at the command line. > seqboot > protpars > fitch If there is no file called infile the program responds with: [gogarten@carrot gogarten]$ seqboot seqboot: can't find input file "infile" Please enter a new file name>
Example 1 Protpars example: seqboot, protpars, consense on infile1 NOTE the bootstrap majority consensus tree does not necessarily have the same topology as the “best tree” from the original data! threshold parsimony, gap symbols - versus ? (in vi you could use :%s/-/?/g to replace all – ?) outfile outtree compare to distance matrix analysis
branches are scaled with respect to bootstrap support values, the number for the deepest branch is handeled incorrectly by njplot and treeview protpars (versus distance/FM) Extended majority rule consensus treeCONSENSUS TREE:the numbers on the branches indicate the numberof times the partition of the species into the two setswhich are separated by that branch occurredamong the trees, out of 100.00 trees +------Prochloroc +----------------------100.-| | +------Synechococ | | +--------------------Guillardia +-85.7-| | | | +-88.3-| +------Clostridiu | | | | +-100.-| | | | +-100.-| +------Thermoanae | +-50.8-| | | | +-------------Homo sapie +------| | | | | +------Oryza sati | | +---------------100.0-| | | +------Arabidopsi | | | | +--------------------Synechocys | | | | +---------------53.0-| +------Nostoc pun | | +-99.5-| | +-38.5-| +------Nostoc sp | | | +-------------Trichodesm | +------------------------------------------------Thermosyne remember: this is an unrooted tree!
what might be the explanation for the red algae not grouping with the plants? (protpars versus) distance/FM Tree is scaled with respect to the estimated number of substitutions. If time: demo of njplot
protdist PROTdist Settings for this run: P Use JTT, PMB, PAM, Kimura, categories model? Jones-Taylor-Thornton matrix G Gamma distribution of rates among positions? No C One category of substitution rates? Yes W Use weights for positions? No M Analyze multiple data sets? No I Input sequences interleaved? Yes 0 Terminal type (IBM PC, ANSI)? ANSI 1 Print out the data at start of run No 2 Print indications of progress of run Yes
subtree with branch lengths without and with correction for ASRV
phyml PHYML - A simple, fast, and accurate algorithm to estimate large phylogenies by maximum likelihood An online interface is here ; there is a command line version that is described here (not as straight forward as in clustalw); a phylip like interface is automatically invoked, if you type “phyml” – the manual is here. Phyml is installed on bbcxsrv1. Do example on atp_all.phy Note data type, bootstrap option within program, models for ASRV (pinvar and gamma), by default the starting tree is calculated via neighbor joining.
phyml - comments Under some circumstances the consensus tree calculated by phyml is wrong. It is recommended to save all the individual trees and to also evaluate them with consense from the phylip package. Note: phyml allows longer names, but consense allows only 10 characters! phyml is fast enough to analyze dataset with hundreds of sequences (in 1990, a maximum likelihood analyses with 12 sequences (no ASRV) took several days). For moderately sized datasets you can estimate branch support through a bootstrap analysis (it still might run several hours, but compared to protml or PAUP, this is extremely fast). The paper describing phyml is here, a brief interview with the authors is here
TreePuzzle ne PUZZLE TREE-PUZZLE is a very versatile maximum likelihood program that is particularly useful to analyze protein sequences. The program was developed by Korbian Strimmer and Arnd von Haseler (then at the Univ. of Munich) and is maintained by von Haseler, Heiko A. Schmidt, and Martin Vingron (contacts see http://www.tree-puzzle.de/).
TREE-PUZZLE • allows fast and accurate estimation of ASRV (through estimating the shape parameter alpha) for both nucleotide and amino acid sequences, • It has a “fast” algorithm to calculate trees through quartet puzzling (calculating ml trees for quartets of species and building the multispecies tree from the quartets). • The program provides confidence numbers (puzzle support values), which tend to be smaller than bootstrap values (i.e. provide a more conservative estimate), • the program calculates branch lengths and likelihood for user defined trees, which is great if you want to compare different tree topologies, or different models using the maximum likelihood ratio test. • Branches which are not significantly supported are collapsed. • TREE-PUZZLE runs on "all" platforms • TREE-PUZZLE reads PHYLIP format, and communicates with the user in a way similar to the PHYLIP programs.
Maximum likelihood ratio test If you want to compare two models of evolution (this includes the tree) given a data set, you can utilize the so-called maximum likelihood ratio test. If L1 and L2 are the likelihoods of the two models, d =2(logL1-logL2) approximately follows a Chi square distribution with n degrees of freedom. Usually n is the difference in model parameters. I.e., how many parameters are used to describe the substitution process and the tree. In particular n can be the difference in branches between two trees (one tree is more resolved than the other). In principle, this test can only be applied if on model is a more refined version of the other. In the particular case, when you compare two trees, one calculated without assuming a clock, the other assuming a clock, the degrees of freedom are the number of OTUs – 2 (as all sequences end up in the present at the same level, their branches cannot be freely chosen) . To calculate the probability you can use the CHISQUARE calculator for windows available from Paul Lewis.
TREE-PUZZLE allows (cont) • TREEPUZZLE calculates distance matrices using the ml specified model. These can be used in FITCH or Neighbor. • PUZZLEBOOT automates this approach to do bootstrap analyses – WARNING: this is a distance matrix analyses! • The official script for PUZZLEBOOT is here – you need to create a command file (puzzle.cmds), and puzzle needs to be envocable through the command puzzle. • Your input file needs to be the renamed outfile from seqboot • A slightly modified working version of puzzleboot_mod.sh is here, and here is an example for puzzle.cmds . Read the instructions before you run this! • Maximum likelihood mapping is an excellent way to • assess the phylogenetic information contained in a dataset. • ML mapping can be used to calculate the support around one branch. • @@@ Puzzle is cool, don't leave home without it! @@@
ml mapping From: Olga Zhaxybayeva and J Peter Gogarten BMC Genomics 2002, 3:4
ml mapping Figure 5. Likelihood-mapping analysis for two biological data sets. (Upper) The distribution patterns. (Lower) The occupancies (in percent)for the seven areas of attraction. (A) Cytochrome-b data fromref. 14. (B) Ribosomal DNA of major arthropod groups (15). From: Korbinian Strimmer and Arndt von HaeselerProc. Natl. Acad. Sci. USAVol. 94, pp. 6815-6819, June 1997
ml mapping (cont) If we want to know if Giardia lamblia forms the deepest branch within the known eukaryotes, we can use ML mapping to address this problem. To apply ml mapping we choose the "higher" eukaryotes as cluster a, another deep branching eukaryote (the one that competes against Giardia) as cluster b, Giardia as cluster c, and the outgroup as cluster d. For an example output see this sample ml-map. An analysis of the carbamoyl phosphate synthetase domains with respect to the root of the tree of life is here. Application of ML mapping to comparative Genome analyses see here for a comparison of different probabil;ity measures see here for an approach that solves the problem of poor taxon sampling that is usually considered inherent with quartet analyses is.
(a,b)-(c,d) /\ / \ / \ / 1 \ / \ / \ / \ / \ / \/ \ / 3 : 2 \ / : \ /__________________\ (a,d)-(b,c) (a,c)-(b,d)Number of quartets in region 1: 68 (= 24.3%)Number of quartets in region 2: 21 (= 7.5%)Number of quartets in region 3: 191 (= 68.2%)Occupancies of the seven areas 1, 2, 3, 4, 5, 6, 7: (a,b)-(c,d) /\ / \ / 1 \ / \ / \ / /\ \ / 6 / \ 4 \ / / 7 \ \ / \ /______\ / \ / 3 : 5 : 2 \ /__________________\ (a,d)-(b,c) (a,c)-(b,d)Number of quartets in region 1: 53 (= 18.9%) Number of quartets in region 2: 15 (= 5.4%) Number of quartets in region 3: 173 (= 61.8%) Number of quartets in region 4: 3 (= 1.1%) Number of quartets in region 5: 0 (= 0.0%) Number of quartets in region 6: 26 (= 9.3%) Number of quartets in region 7: 10 (= 3.6%) Cluster a: 14 sequencesoutgroup (prokaryotes) Cluster b: 20 sequencesother Eukaryotes Cluster c: 1 sequencesPlasmodium Cluster d: 1 sequences Giardia
TREE-PUZZLE – PROBLEMS/DRAWBACKS • The more species you add the lower the support for individual branches. While this is true for all algorithms, in TREE-PUZZLE this can lead to completely unresolved trees with only a few handful of sequences. • Trees calculated via quartet puzzling are usually not completely resolved, and they do not correspond to the ML-tree:The determined multi-species tree is not the tree with the highest likelihood, rather it is the tree whose topology is supported through ml-quartets, and the lengths of the resolved branches is determined through maximum likelihood.
ml mapping can asses the topology surrounding an individual branch : E.g.: If we want to know if Giardia lamblia forms the deepest branch within the known eukaryotes, we can use ML mapping to address this problem. To apply ml mapping we choose the "higher" eukaryotes as cluster a, another deep branching eukaryote (the one that competes against Giardia) as cluster b, Giardia as cluster c, and the outgroup as cluster d. For an example output see this sample ml-map. An analysis of the carbamoyl phosphate synthetase domains with respect to the root of the tree of life is here.
ml mapping can asses the not necessarily treelike histories of genome Application of ML mapping to comparative Genome analyses see here for a comparison of different probability measures. Fig. 3: outline of approach Fig. 4: Example and comparison of different measures see here for an approach that solves the problem of poor taxon sampling that is usually considered inherent with quartet analyses.Fig. 2: The principle of “analyzing extended datasets to obtain embedded quartets” Example next slides:
COMPARISON OF DIFFERENT SUPPORT MEASURES A: mapping of posterior probabilities according to Strimmer and von Haeseler B: mapping of bootstrap support values C: mapping of bootstrap support values from extended datasets Zhaxybayeva and Gogarten, BMC Genomics 2003 4: 37
bootstrap values from extended datasets More gene families group species according to environment than according to 16SrRNA phylogeny In contrast, a themophilic archaeon has more genes grouping with the thermophilic bacteria ml-mapping versus