Download

1 / 23
230 likes | 336 Views
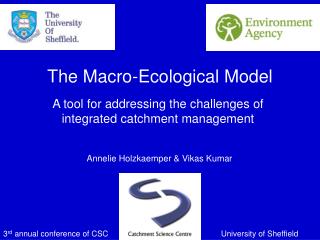
The Macro-Ecological Model. A tool for addressing the challenges of integrated catchment management. Annelie Holzkaemper & Vikas Kumar. 3 rd annual conference of CSC. University of Sheffield. MEM Project team. Academics:

E N D
The Macro-Ecological Model A tool for addressing the challenges of integrated catchment management Annelie Holzkaemper & Vikas Kumar 3rd annual conference of CSC University of Sheffield
MEM Project team Academics: David N. Lerner, Lorraine Maltby, Philip Warren, John Wainwright, Clive W. Anderson, Mahesan Niranjan, Bob Harris Researchers: Vikas Kumar, Ben Surridge, Achim Paetzold EA Project Steering Group: Colin Gibson, Stuart Kirk, Hilary Aldridge, Aileen Kirmond, Viki Hirst, Mark Diamond, Craig Elliot, Paul Logan
Why do we need the MEM? Engineering News Report 1993
Why do we need the MEM? • to support high-level decision making in integrated catchment management • to support communication among different planning functions within the EA
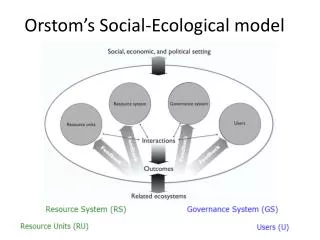
Ecol. Status Chem. Status Flood risk What is the MEM? Model Inputs management scenarios Physical Environment Chemical Environment Management objectives Social and economic Environment Biological Environment The MEM Model Outputs changes in status of objectives
How do we develop the MEM? Bayesian belief network (BBN) Sprinkler Rain Wet grass
Biological quality Physico-chemical quality GQA biology Number of properties affected Phosphate concentration How do we develop the MEM? Step 1: Identification of index variables to represent objectives Ecological status Flood risk
Threshold rain- fall events Urban sealing Secondary channels Organic pollution Embankments Urban storm- water runoff Restored wetland CSO storage capacity PO4 from degrad. Channel maintenance PO4 from CSO’s C-F connectivity Soil P Channel vegetation Riparian buffer Land erodability Soil type Field buffers Plant uptake Agricultural drainage Microbial uptake Sedi.,Adsorp., Precip. Sediment- bound PO4 Pathway PO4 load to river Transformation PO4 conc. Dissolved P04 PO4 in indu- strial effluent Applied P Bed&Bank erosion River flow Rainfall PO4 in STW effluent PO4 from septic tanks PO4 in urban runoff Urban sealing Precipitation How do we develop the MEM? Step 2: Development of conceptual sub-model
Riparian buffer PO4 load from CSO’s Restored wetland Embankments Livestock Arable land PO4 load from agriculture PO4 load to river PO4 conc. Managed grassland River discharge PO4 load from STW effluent How do we develop the MEM? Step 3: Simplification of conceptual sub-model
Riparian buffer PO4 load from CSO’s Restored wetland Embankments Livestock Arable land PO4 load from agriculture PO4 load to river PO4 conc. Managed grassland River discharge PO4 load from STW effluent PSYCHIC How do we develop the MEM? Step 4: Specification of sub-model SIMCAT
Biological quality-module Microbial activity Light Algae O2 Invertebrates Discharge Land use Abstraction Rainfall Hydrology-module How do we develop the MEM? Step 5: Merging of sub-models Water quality-module PO4 load PO4 conc.
How could the MEM be applied? • Baseline Scenario: • Current conditions MEM MEM prediction: Ecological status Flood risk Number of properties affected by 100-year flood Number of water bodies passing standards GQAbio PO4
How could the MEM be applied? • Management-Scenario 1: • 30% reduction of PO4 inputs from sewage treatment works • Introduction of embankments in 50% of lowland water bodies MEM prediction: Ecological status Flood risk Number of properties affected by 100-year flood Number of water bodies passing standards GQAbio PO4
How could the MEM be applied? • Management-Scenario 2: • 20% reduction in number of livestock • Introduction of restored wetlands in 10% of lowland water bodies • Introduction of riparian buffers in 20% of lowland water bodies MEM prediction: Ecological status Flood risk Number of properties affected by 100-year flood Number of water bodies passing standards GQAbio PO4
Summary • Objectives tools are required to assist in integrated catchment management • Decision support for integrated management can be provided through integrated modelling • The BBN is a suitable approach for integrating knowledge from different resources • The MEM will predict impacts of management scenarios on multiple objectives
Thank you for your attention! http://www.shef.ac.uk/mem.html
Shading Turbidity PO4 load from STW effluent PO4 load from CSO’s Light Livestock Weirs BOD Algae Phosphate PO4 load to river PO4 load from agriculture Arable land O2 Managed grassland Embankments Restored wetlands Riparian buffer River discharge Flow variability GQA biology Concrete substrate Channel roughness Flood extent Properties affected by flood Ammonia Properties within floodplain How do we develop the MEM?
How do we develop the MEM? Shading Turbidity Light Weirs BOD Algae Phosphate O2 Flow variability GQA biology Concrete substrate Ammonia
Step 1: Model identification Example: PSYCHIC Inputs: Output: Land use Livestock numbers Area of crop types Precipitation Temperature Soil type Slope Proximity to surface waters Land use Livestock numbers Area of crop types Precipitation Temperature Soil type Slope Proximity to surface waters P load delivered to river
Inputs Output Run 0 % Arable Livestock number … PO4 load wb1 10 60 … 5.2 … … … … … wbn 15 10 … 3.1 Inputs Output Run 1 % Arable Livestock number … PO4 load wb1 10 30 … 3.9 … … … … … wbn 15 5 … 2.5 Step 2: Multiple model runs Run 0: Current conditions Run 1: 50% reduction in number of livestock
Managed grassland Temperature Precipitation Arable land Proximity PO4 load Soil type Livestock Slope Step 3: BBN structure definition PSYCHIC inputs PSYCHIC output
Arable land Livestock PO4 load Step 4: BBN specification Managed grassland
Arable land Livestock PO4 load A B C Step 5: BBN application Conditional probabilities for PO4 conc. on water body scale: A Managed grassland B C A B C A B C