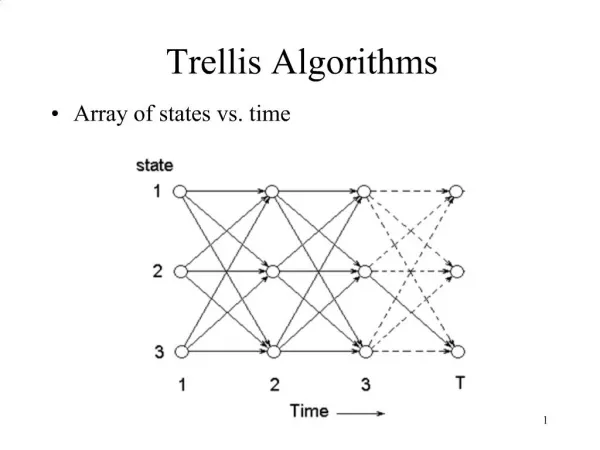
Lattice and trellis graphics (mostly splom)
60 likes | 300 Views
Lattice and trellis graphics (mostly splom). CONT INTG DMNR DILG CFMG DECI PREP FAMI ORAL WRIT PHYS RTEN AARONSON,L.H. 5.7 7.9 7.7 7.3 7.1 7.4 7.1 7.1 7.1 7.0 8.3 7.8 ALEXANDER,J.M. 6.8 8.9 8.8 8.5 7.8 8.1 8.0 8.0 7.8 7.9 8.5 8.7

Lattice and trellis graphics (mostly splom)
E N D
Presentation Transcript
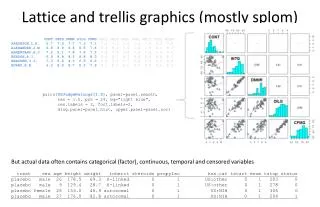
Lattice and trellis graphics (mostly splom) CONT INTG DMNR DILG CFMG DECI PREP FAMI ORAL WRIT PHYS RTEN AARONSON,L.H. 5.7 7.9 7.7 7.3 7.1 7.4 7.1 7.1 7.1 7.0 8.3 7.8 ALEXANDER,J.M. 6.8 8.9 8.8 8.5 7.8 8.1 8.0 8.0 7.8 7.9 8.5 8.7 ARMENTANO,A.J. 7.2 8.1 7.8 7.8 7.5 7.6 7.5 7.5 7.3 7.4 7.9 7.8 BERDON,R.I. 6.8 8.8 8.5 8.8 8.3 8.5 8.7 8.7 8.4 8.5 8.8 8.7 BRACKEN,J.J. 7.3 6.4 4.3 6.5 6.0 6.2 5.7 5.7 5.1 5.3 5.5 4.8 BURNS,E.B. 6.2 8.8 8.7 8.5 7.9 8.0 8.1 8.0 8.0 8.0 8.6 8.6 ... pairs(USJudgeRatings[1:5], panel=panel.smooth, cex = 1.5, pch = 24, bg="light blue", cex.labels = 2, font.labels=2, diag.panel=panel.hist, upper.panel=panel.cor) But actual data often contains categorical (factor), continuous, temporal and censored variables treat sex age height weight inherit steroids propylac hos.cat tstartenumtstop status placebo male 26 178.5 69.3 X-linked 0 1 US:other 0 1 203 0 placebo male 9 129.4 28.7 X-linked 0 1 US:other 0 1 278 0 placebo female 26 153.0 46.9 autosomal 0 1 US:NIH 0 1 306 0 placebo male 27 176.0 82.8 autosomal 0 1 US:NIH 0 1 294 1
Example of my splom ‘supergraphic’ sex treat inherit steroids OS 139 male placebo X-linked 0 23 85 female placebo autosomal 0 330 70 male rIFN-g X-linked 0 11 60 male placebo X-linked 0 141 164 male placebo autosomal 0 54 100 male placebo X-linked 0 34 98 male placebo X-linked 0 181 72 male rIFN-g X-linked 0 304 166 male rIFN-g X-linked 0 263 61 male placebo X-linked 0 175 41 male placebo X-linked 0 36 113 male placebo X-linked 0 318 161 male rIFN-g X-linked 0 259 24 male placebo X-linked 0 19 196 female rIFN-g autosomal 0 197 127 male rIFN-g X-linked 0 297 36 male rIFN-g autosomal 0 32 94 male placebo X-linked 0 13 6 male placebo autosomal 0 126 92 female rIFN-g autosomal 0 334 174 female placebo autosomal 0 271 201 female placebo autosomal 0 104 188 male placebo autosomal 0 11 124 male placebo autosomal 0 22 86 male placebo X-linked 0 300 49 male rIFN-g X-linked 0 360 134 female rIFN-g autosomal 0 303 44 male placebo X-linked 0 344 184 male placebo X-linked 0 91 107 female placebo X-linked 1 30 Etc. etc. Splom – Scatter PLotMatrix
Detail view of factor – factor and factor – censored panels Internal factor labels Raw counts in each box Drop lines for events (also on the axes) Shading proportional to the significance of the box
Example of the same data, but with violin plots vs. Q-Q plots to show two ways of depicting factor – continuous data Information text and numbers proportional to significance of the results Same A small sample of the underlying data as part of the sub-text
Details of the call splom(~dat, data=dat, par.settings=simpleTheme(col=brewer.pal(n=8, name="Dark2"), pch=19:25), auto.key=list(space="right"), main=paste("Test with the Chronic GranulotomousDisease data", Sys.Date()), sub=subText(data=dat, rot=0), xlab=NULL, alpha=0.3, varname.cex=0.6, axis.line.col="antiquewhite", axis.line.lty=3, pscales=0, use.prefix=TRUE, digits=1, cex.cor=NULL, text.cex=0.6, factor.numeric="violin", guess=TRUE, prepanel.limits = guessDataLimits, lower.panel = panel.graphicSplom, upper.panel = panel.numericSplom)