Download
1 / 5
50 likes | 121 Views
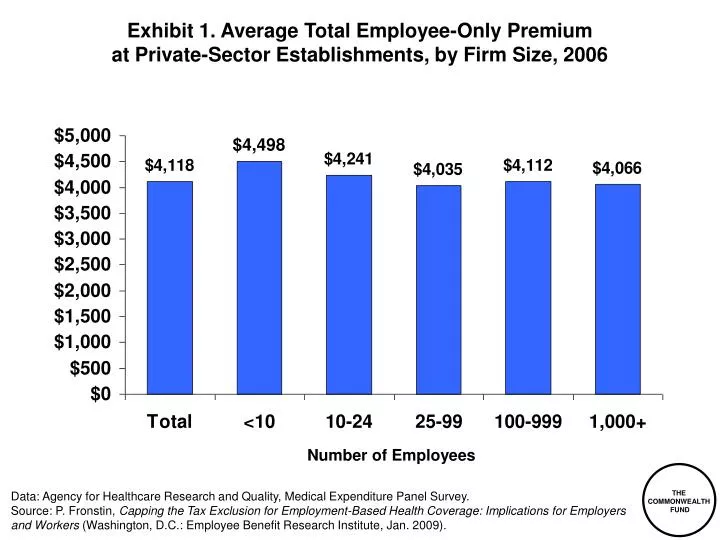
Exhibit 1. Average Total Employee-Only Premium at Private-Sector Establishments, by Firm Size, 2006. Number of Employees. Data: Agency for Healthcare Research and Quality, Medical Expenditure Panel Survey.

E N D
Exhibit 1. Average Total Employee-Only Premium at Private-Sector Establishments, by Firm Size, 2006 Number of Employees Data: Agency for Healthcare Research and Quality, Medical Expenditure Panel Survey. Source: P. Fronstin, Capping the Tax Exclusion for Employment-Based Health Coverage: Implications for Employers and Workers (Washington, D.C.: Employee Benefit Research Institute, Jan. 2009).
Exhibit 2. Average Total Family Premium at Private-Sector Establishments, by Geographic Region, 2008 Region Data: Kaiser/HRET 2008. Source: P. Fronstin, Capping the Tax Exclusion for Employment-Based Health Coverage: Implications for Employers and Workers (Washington, D.C.: Employee Benefit Research Institute, Jan. 2009).
Exhibit 3. ESI Tax Subsidies in Absolute Dollars and as a Percentage of After-Tax Income, for Tax Units with ESI, 2004 Data: Tax Policy Center calculations based on HIPSM database. Source: L. Burman, B. Garrett, and S. Khitatrakun, “The Tax Code, Employer-Sponsored Insurance and the Distribution of Tax Subsidies” in H. J. Aaron and L. E. Burman (eds.), Using Taxes to Reform Health Insurance:Pitfalls and Promises, Brookings Institution, 2008.
Exhibit 4. Current ESI Tax Subsidies in Absolute Dollars and as a Percentage of After-Tax Income, for Tax Units with ESI, 2004 Average Subsidy (Dollars) Subsidy as a Percentage of Income Income (thousands), Tax Units with ESI Income (thousands), Tax Units with ESI Data: Tax Policy Center calculations based on HIPSM database. Source: L. Burman, B. Garrett, and S. Khitatrakun, “The Tax Code, Employer-Sponsored Insurance and the Distribution of Tax Subsidies” in H. J. Aaron and L. E. Burman (eds.), Using Taxes to Reform Health Insurance:Pitfalls and Promises, Brookings Institution, 2008.
Exhibit 5. Effect of Ending Current ESI Tax Subsidies,for Tax Units with ESI, 2004 Percentage Increase in Total Income Taxes Changes in Average Income Tax Rates Income (thousands), Tax Units with ESI Income (thousands), Tax Units with ESI Note: Percentage increase in total income taxes is change in tax liability divided by baseline tax liability. Data on percentage increase is not shown for tax units with less than $30,000 in income due to very low baseline tax liability. Change in average income tax rates is new tax divided by new income minus baseline tax divided by baseline income. Data: Tax Policy Center calculations based on HIPSM database.