Understanding Exponential Functions: Evaluation, Graphs, and Transformations
Study exponential functions with base b, evaluating and graphing them to understand exponential growth and decay. Explore the characteristics of exponential functions and learn about transformations to shift and reflect graphs. Examples illustrate exponential growth and decay functions, with insights on domain, range, horizontal asymptotes, and transformations.


Understanding Exponential Functions: Evaluation, Graphs, and Transformations
E N D
Presentation Transcript
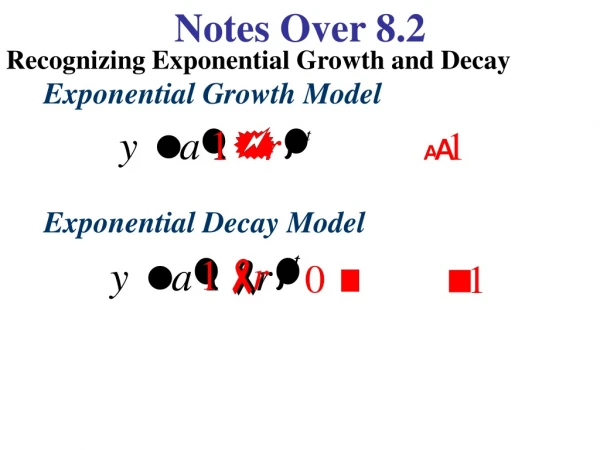
6.3 Exponential Functions In this section, we will study the following topics: Evaluating exponential functions with base b Graphing exponential functions with base b 1
So, in an exponential function, the variable is in the exponent.
Exponential Functions Which of the following are exponential functions? 3 ( ) f x x 3x ( ) f x ( ) f x 5 1x ( ) f x 3
Graphs of Exponential Functions Just as the graphs of all quadratic functions have the same basic shape, the graphs of exponential functions have the same basic characteristics. They can be broken into two categories— exponential growth exponential decay (decline) 4
The Graph of an Exponential Growth Function We will look at the graph of an exponential function that increases as x increases, known as the exponential growth function. It has the form x ( ) f x a where a > 1. Example: f(x) = 2x x f(x) f(x)=2x Notice the rapid increase in the graph as x increases -5 The graph increases slowly for x < 0. -4 -3 -2 y-intercept is (0, 1) -1 0 1 2 Horizontal asymptote is y = 0. 3 5
The Graph of an Exponential Decay (Decline) Function We will look at the graph of an exponential function that decreases as x increases, known as the exponential decay function. It has the form a x ( ) f x where a > 1. Example: g(x) = 2-x g(x)=2-x x f(x) Notice the rapid decline in the graph for x < 0. -3 The graph decreases more slowly as x increases. -2 -1 y-intercept is (0, 1) 0 1 2 3 Horizontal asymptote is y = 0. 4 5 7
Graphs of Exponential Functions Notice that f(x) = 2xand g(x) = 2-x are reflections of one another about the y-axis. Both graphs have: y-intercept (___,___) and horizontal asymptote y = . The domain of f(x) and g(x) is _________; the range is _______. 8
Graphs of Exponential Functions x 1 Also, note that , using the properties of exponents. ( ) 2 2 x g x So an exponential function is a DECAY function if The base a is greater than one and the function is written as f(x) = b-x -OR- The base a is between 0 and 1 and the function is written as f(x) = bx 9
Graphs of Exponential Functions Examples: ( ) f x x 0.25x ( ) f x 5.6 In this case, a = 0.25 (0 < a < 1). In this case, a = 5.6 (a > 1). 10
Transformations of Graphs of Exponential Functions Look at the following shifts and reflections of the graph of f(x) = 2x. ( ) f x 2x ( ) f x 2x ( ) g x x 2 3 2 2x ( ) g x The new horizontal asymptote is y = 3 11
Transformations of Graphs of Exponential Functions ( ) f x 2x x ( ) g x 2 ( ) f x 2x ( ) g x 2x 12
Transformations of Graphs of Exponential Functions ( ) f x 2x Describe the transformation(s) that the graph of must undergo in order to obtain the graph of each of the following functions. State the domain, range and the horizontal asymptote for each. ( ) f x x 2 5 1. 13
Transformations of Graphs of Exponential Functions ( ) f x 2x Describe the transformation(s) that the graph of must undergo in order to obtain the graph of each of the following functions. State the domain, range and the horizontal asymptote for each. 1 2x ( ) f x 2. 14
Transformations of Graphs of Exponential Functions ( ) f x 2x Describe the transformation(s) that the graph of must undergo in order to obtain the graph of each of the following functions. State the domain, range and the horizontal asymptote for each. x ( ) f x 2 4 3. 15
Transformations of Graphs of Exponential Functions ( ) f x 2x Describe the transformation(s) that the graph of must undergo in order to obtain the graph of each of the following functions. State the domain, range and the horizontal asymptote for each. 3 2x ( ) f x 4. 16
Graph using transformations and determine the domain, range and horizontal asymptote. B) A) D) C)