Understanding Eutrophication: Empirical and Mechanistic Models
Learn about nutrient-driven plant growth, natural vs. cultural eutrophication, and the impact of phosphorus in freshwaters. Explore manifestations like algae bloom and oxygen depletion in this lab assignment. Temperature and transparency data analysis also covered.

Understanding Eutrophication: Empirical and Mechanistic Models
E N D
Presentation Transcript
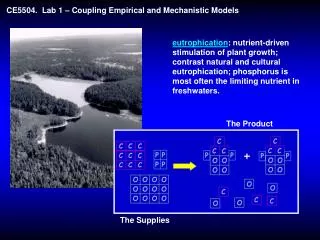
The Product The Supplies CE5504. Lab 1 – Coupling Empirical and Mechanistic Models eutrophication: nutrient-driven stimulation of plant growth; contrast natural and cultural eutrophication; phosphorus is most often the limiting nutrient in freshwaters.
Manifestations of eutrophication - transparency Dodson 2005
Summer Spring Depth (m) Temperature (°C) Manifestations of eutrophication – oxygen depletion
mgO2L-1 A M J J A S Manifestations of eutrophication – oxygen depletion
Q∙P W As V v∙As BUDGET MODEL for phosphorus
3 log Chl = 0.813log TP-0.240 R2 = 0.59 2 log chlorophyll (mgm-3) 1 0 (b) -1 -1 1 0 2 3 log total phosphorus (mgPm-3) TROPHIC STATE CORRELATIONS – phosphorus and chlorophyll
(a) 3.0 2.0 Secchi Disk Transparency (m) 1.0 0.5 log SD = -0.54log Chl + 0.78 R2 = 0.76 10 50 2.5 5 25 50 Chlorophyll (mgm-3) TROPHIC STATE CORRELATIONS – chlorophyll and Secchi disk
(c) Areal Hypolimnetic Oxygen Demand (gO2m-2d-1) AHOD = 0.0145TP + 0.47 R2 = 0.79 Total Phosphorus (mgPm-3) TROPHIC STATE CORRELATIONS – phosphorus and AHOD
ASSIGNMENT: Lab 1. Coupling Empirical and Mechanistic Models