Download
1 / 15
150 likes | 281 Views
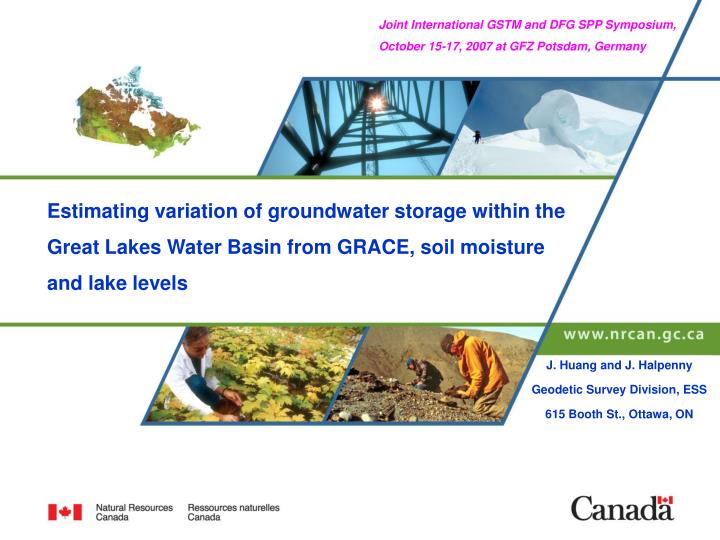
Joint International GSTM and DFG SPP Symposium, October 15-17, 2007 at GFZ Potsdam, Germany. Estimating variation of groundwater storage within the Great Lakes Water Basin from GRACE, soil moisture and lake levels. J. Huang and J. Halpenny Geodetic Survey Division, ESS

E N D
Joint International GSTM and DFG SPP Symposium, October 15-17, 2007 at GFZ Potsdam, Germany Estimating variation of groundwater storage within the Great Lakes Water Basin from GRACE, soil moisture and lake levels J. Huang and J. Halpenny Geodetic Survey Division, ESS 615 Booth St., Ottawa, ON
Outline • Introduction • Method • Analysis of monthly GRACE models • Estimation of groundwater variation • Conclusions Canada’s Natural Resources – Now and for the Future
1. Introduction Area of the Great Lakes Water Basin: 766,000 km2 L. Huron: 59,600 km2 L. Superior: 82,000 km2 Quebec L. Ontario: 18,960 km2 L. Michigan: 57,800 km2 L. Erie: 25,700 km2
2. Method (1/2) Spherical Harmonic Coefficients Processing flowchart: SM: Soil Moisture GL: Great Lakes GW: Groundwater
2. Method (2/2) Time-Variable (TV) geoid from GRACE: The model for Least-squares fitting of harmonic time-variable coefficients: Velocity at epoch ti: Signal-to-Noise Ratio (SNR):
3. Analysis of monthly GRACE models (1/5) Spherical harmonic coefficient time series (red dots) and their LS fitting (blue dot line): S8,1 S12,1 S16,1 S20,1 S12,7 S16,9 S20,11 S8,5
n n n n Snm Snm Snm Snm m m m m n n n n Cnm Cnm Cnm Cnm m m m m 3. Analysis of monthly GRACE models (2/5) Linear: Quadratic: Annual: Semi-annual:
3. Analysis of monthly GRACE models (3/5) RMS signal per degree vs. a posteriori standard deviation: Linear: Quadratic: n=14 Annual: Semi-annual:
3. Analysis of monthly GRACE models (4/5) Trend (RMS = 15 mm/a): Annual (RMS = 37 mm): Semi-annual (RMS = 5 mm): Residual (RMS = 27 mm):
B: Least-Squares Fitting + Gaussian Filtering A: Gaussian Filtering 3. Analysis of monthly GRACE models (5/5) Unit: mm
w(,) = 4. Estimation of groundwater variation (1/4) The mean water-thickness-equivalent over the GLB by: Simulation: Each component by:
4. Estimation of groundwater variation (2/4) CSRRL04: (60 months) GFZRL04: (53 months)
4. Estimation of groundwater variation (3/4) Lake Levels: GLDAS SM&SW:
4. Estimation of groundwater variation (4/4) Groundwater Estimation from CSRRL04: Groundwater Estimation from GFZRL04:
5. Conclusions • The combination of the least-squares fitting and Gaussian filtering enhances the extracted GRACE signal by about 10% over the Gaussian filtering alone. • The total water storage variation (RMS=3.5 cm) from GRACE demonstrates close agreement (magnitude and phase) to the soil moisture and snow variation (RMS=3.7 cm) from GLDAS over the Great Lakes Water Basin. • The mean lake level variation (RMS=4.1 cm) over the basin demonstrates a comparable magnitude to the GRACE estimate but a phase lag of about 3 months. • The estimated groundwater variation (RMS=4.1 cm) implies that groundwater plays a key role in replenishing the Great Lakes.