Download
1 / 19
190 likes | 273 Views
Explore the impact of agricultural expansion on deforestation in Mato Grosso from 2001-2004. Analyze carbon changes, habitat fragmentation, and drivers driving land use transitions.

E N D
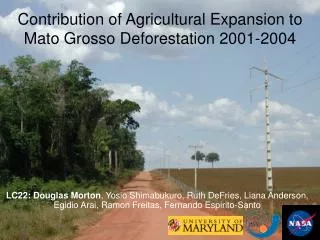
Contribution of Agricultural Expansion to Mato Grosso Deforestation 2001-2004 LC22: Douglas Morton, Yosio Shimabukuro, Ruth DeFries, Liana Anderson, Egidio Arai, Ramon Freitas, Fernando Espirito-Santo
What are the ecological implications of direct transitions from forest to cropland in Mato Grosso? • Carbon: Changes in timing, spatial extent, and retained AGB are different between pasture and agriculture clearings. • Habitat: Large clearings for cropland fragment the landscape and alter infrastructure needs. • Drivers and future trends: Agricultural pressures are a part of any discussion on the future of Amazonia, but census data are an indirect measure of the contribution of cropland expansion to deforestation. The fate of deforested lands can be assessed directly: Combine high-resolution deforestation information (PRODES) and time series of MODIS imagery.
Dry season confusion between deforestation and cropland Wet-season class confusion with NDVI Classes separable with NDVI Maximum Minimum Amplitude Using phenological curves from satellite data to classify land cover
Classification Tree From 2004 Field Data ndvi.dry.mean <8239 forest ndvi.dry.med <4174 ndvi.wet.max <8422 ndvi.ann.amp pasture ndvi.1st.harmonic <4850 <-349 deforestation evi.wet.amp agriculture ndvi.ann.med <4964 <3918 agriculture ndvi.dry.stdv pasture <1905 agriculture pasture deforestation
Pasture and agriculture are highly separable based on time series metrics. Answer—use PRODES polygons >25 hectares to identify deforestation (~Aug.), and the time series (Oct.-Oct.) to classify outcome with high confidence. Method—Summarize the majority class within each PRODES polygon. Validation of Classification Accuracy Using 2005 Field Data , Majority in Each Training Polygon
Indigenous Reserve Boundaries
Percent PRODES area in MT by class for large (>25ha) events 2001-2004 PRODES 2001 >25ha (Total = 5782 km2) Pasture Forest PRODES 2002 >25ha (Total = 8656 km2) Deforestation Agriculture PRODES 2003 >25ha (Total = 9144 km2) PRODES 2004 >25ha (Total = 8671 km2)
PRODES 2001, area by class following deforestation PRODES 2003, area by class Forest Pasture Deforestation Agriculture PRODES 2002, area by class PRODES 2004, area by class
Trajectory Corrections • Time series provides valuable information about both land use practices and misclassification. Examples: • A-A-P-A = A-A-A-A • P-D-P-P = P-P-P-P • P-A-A-A = A-A-A-A • Fallow cycles, single crop rotation, pasture burning, variable view angle from MODIS (forest edge problems). • These patterns can be interpreted to present information about land use and clarify the pasture/agriculture component of new clearing.
Majority classification of PRODES 2001, Unadjusted Pasture Forest Deforestation Agriculture Trajectory classification of PRODES 2001 Trajectory-adjusted results show more consistent trends over time. Fewer PRODES polygons remain in the deforestation/edge class, and forest edge/regrowth stabilizes around 7%.
Forest conversion to agriculture between 2000 and 2004 constitutes 25% of new agriculture in Mato Grosso during this period (Morton et al., in press). Trajectory results Total Deforestation Agriculture
unadjusted The percentage of the largest clearings that transition directly to agriculture increased for PRODES 2003. Unadjusted results for 2004 show the same number of large clearings, but a lower percentage in agriculture in 2004-2005. Direct conversion for agriculture is more common for the largest deforestation areas.
Slope as a predictor of Deforestation outcome • Slope a defining characteristic of site suitability for mechanized agriculture (Jasinski et al., 2005 Earth Interactions) • New agricultural areas follow similar trend.
Conclusions • Direct conversion of forest to agriculture is a large and growing percentage of deforestation in Mato Grosso between 2001-2005. Carbon impacts: Bookkeeping approach: ~20% of AGB lost to burning. Field data suggest 100% combustion completeness is possible for conversion to agriculture. No regrowth on this timeframe. LC-39: Estimating the carbon loss from various types of land use fires in Amazonia. Ag Clearing Bookkeeping Approach C Emissions time