Understanding Macroeconomics: GDP, Inflation, and Unemployment Overview
Learn about key macroeconomic concepts like GDP, inflation, and unemployment, and their impact on the economy. Explore measurement methods and economic policies to manage these factors.


Understanding Macroeconomics: GDP, Inflation, and Unemployment Overview
E N D
Presentation Transcript
Outline • Measurement • National income (GDP) and unemployment • Business cycles • Aggregate supply and demand model • Money • Money supply and demand • Monetary and fiscal policy • Activist versus non-activist policy
Gross Domestic Product • Objective: Estimate the amount of economic activity • Approaches • measure output • measure expenditure • measure income • These all measure the SAME THING!
Gross Domestic Product Gross Domestic Product (GDP) is the most common measure of economic activity GDP – The market value of all finalgoods and services produced in a year, within a country’s borders
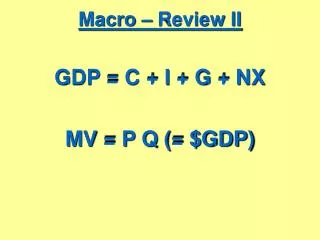
Expenditure GDP = C + I + G + NX C – Consumption expenditures I – Investment expenditures • machines, equipment, structures, software and inventory G – Government purchases of goods and services NX – net exports = Exports minus imports
Income and output GDP = output of the economy • Output produced using land, labor and capital Payment to resources • Wages – payment to labor • Interest and profits – payment to capital (includes dividends) • Rent - payment to land GDP = wages + interest & profits + Rent
Real and Nominal GDP • Nominal value – the value in current dollars • Expenditure method: GDP = C + I + G + NX • measured in current market prices • Real value – the value in constant dollars
Inflation • Inflation – sustained rise in the average level of prices • Deflation – sustained decline in average level of prices • Price level – measured using a price index • Price index measures average, not relative prices
Calculating the inflation rate Inflation rate is found by calculating the percent change in the price index Inflation rate 1977-1978 = Inflation rate 2007-2008 = Source: BLS, base year 1984-1982 average. End of period
CPI inflation record, USA Source: Bureau of Labor Statistics
Consequences Inflation • Inflation erodes the purchasing power of money • Results in loss of purchasing power of monetary and fixed income assets • Bank deposits, CDs, Bonds • Results in a decrease in debt burden as purchasing power of debts fall • Creates confusion about future prices
The “inflation tax” • Inflation distributes income from those with fixed incomes to those with fixed costs. • Inflation acts as a tax on fixed income receipts • Tax on lenders/savers • The real value of fixed income falls as prices rise • The real value of fixed payments fall as prices rise
Unemployed • To be considered unemployed, a person must • not have a job • be 16 years of age or older • be actively seeking employment, or awaiting recall • People not working and who are also not looking for work are notconsidered unemployed
Unemployment rate The labor force = employed + unemployed persons • Interpret as the number of available workers The unemployment rate = unemployed divided by labor force
Example, USA Source: Bureau of Labor Statistics Calculate the labor force Calculate the unemployment rate
Types of Unemployment Frictional– Unemployment caused by short-term movement of workers and first time job seekers. Structural – Unemployment caused by technological or structural changes in the economy Cyclical – Unemployment caused by recession
The natural rate of unemployment Natural Rate of Unemployment – • The unemployment rate with no cyclical unemployment • Frictionaland structuralunemployment are always present in the economy
Potential GDP When unemployment = natural rate • real GDP = potential • No cyclical unemployment
Model of GDP determination GDP = output = expenditure • Output: Everything produced by land, labor and capital • Aggregate supply • Expenditure: C + I + G + NX • Aggregate demand
Model of GDP determination GDP = output = expenditure • Output: Everything produced by land, labor and capital • Aggregate supply • Expenditure: C + I + G + NX • Aggregate demand
Long-run Aggregate Supply • Long-run: real GDP is equal to potential GDP • Potential GDP is the most an economy can produce with resources and technology • Potential GDP is independent of price level
Long-run Aggregate Supply Curve Price level LRAS Real GDP Yp The long-run Aggregate Supply curve is a vertical line at Potential GDP (Yp)
Short-run Aggregate Supply • Short-run: • Prices of resources/input and costs of production are assumed to be fixed • Price of output may vary • As the price of output increases, the quantity of output supplied (real GDP) increases. • In the short-run, there is a positive relationship between price level and output (real GDP) supplied
Short-run Aggregate Supply Curve Price level SAS LRAS Real GDP Yp There is a positive relationship between SAS and price level
Aggregate Demand Aggregate expenditure: • Consumption (C) • Expectations, wealth • Investment (I) • Expectations, interest rate • Government Purchases (G) • Policy – can deficit if tax revenue not available • Net Exports (NX) • Exchange rate, relative prices, foreign income
Aggregate Demand Price level AD Real GDP There is a negative/inverse relationship between price level and Aggregate demand
Equilibrium Price level SAS LRAS AD = C + I + G + NX Real GDP Yp Long-run equilibrium, all curves meet at potential
Recession SAS Price level AD Real GDP Y’ Yp During recession, real GDP may be less than potential
Responses to recessions Activist/Keynesian response to recession • Use fiscal policy to increase AD • This is counter-cyclical policy • Increase government purchases (G) • Reduce taxes Increase consumption (C) Keynesians are all about Aggregate Demand!! • Multiplier effects: increase in G of $1 leads to greater increase in AD
Response to recession SAS Price level AD’ AD Real GDP Y’ Yp Increase AD to fight recession
Discretionary/automatic stabilizers Discretionary policy • Planned expenditures: American Recovery and Reinvestment act (ARRA) Automatic Stabilizers • Element of fiscal policy that changes automatically as income (real GDP) changes • Example: progressive taxes, unemployment benefits Result: Deficits higher during recessions
Consequences of deficits Richardian equivalency theory Crowding out theory Supply-side economics
Ricardian Equivalence theory • AD shift is the same if government borrows or increases taxes to finance spending • households see government borrow • expect an increase taxes in the future • save more (spend less) to pay future taxes • Result: expansion of AD depressed • David Ricardo (1772 – 1823)
Richardian equivalence SAS Price level AD = AD’ Real GDP Y’ Yp No increase in AD as result of increase in G or reduction in taxes
Crowding out theory • The government issues bonds to finance spending • Businesses also issue bonds to finance investment (I) • Government and businesses compete for the same funds • government borrowing “crowds out”, or reduces, private investment • Depresses increase in AD from government spending
Crowding out SAS Price level AD’ AD ‘’ AD Real GDP Y’ Yp Increase in AD caused by increase in G offset by decrease in I
Financing with Tax Revenue Eventually, government spending has to be financed with tax revenue Taxes reduce incentive to work • As tax rates increase, hours worked per person decreases • Leads to a decrease in potential GDP and decrease in LRAS
Supply-side Economics • The study of the effect of taxation on aggregate supply is “supply-side economics” • Increase tax rates reduces in economic activity • less income available to tax • A decrease in tax rates increases economic activity • more income available to tax
Taxes and hours worked 2004 Sources: Taxes: McDaniel 2007, Hours worked: GGDC and OECD
Taxation on LRAS Price level LRAS’ LRAS Real GDP Yp’ Yp Increasing income tax rates leads to a decrease in potential GDP
Activists and non-activist • Keynesian/New Keynesian • Intervene to increase AD – benefits outweigh cost • New Classical • Supply-side effects are powerful • Richardian equivalence means AD shift will be small
Functions of Money Money must perform the following functions: • Medium of exchange • Satisfies double coincidence of wants • Unit of account • Goods are prices in money • Store of value • Maintains purchasing power • Standard of deferred payment • Debts denominated in money
Types of Money • Commodity Money • money with intrinsic value • Example: gold coins • Fiduciary money or fiat currency • money backed by trust • U.S. dollar is a fiat currency
Defining Money There are two official measures of the U.S. money supply M1 = Currency + checking deposits + travelers checks M2 = M1 + savings deposits + CD + retail Money market Money expands through the banking system