Download

1 / 27
270 likes | 421 Views
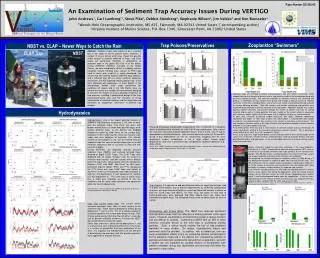
La Rochelle Hydrodynamics. What’s new. Study Area. Operational model. Operational since 01/01/2014 Meteo : GFS 50 km Open Boundary conditions : Mercator Ocean Discharges : monthly averages from 2012 data ( not available real time data). La Rochelle operational model.

E N D
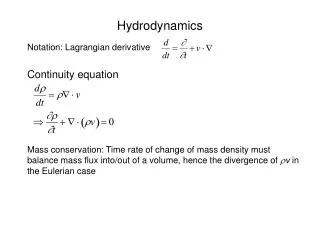
La RochelleHydrodynamics What’snew
Operationalmodel • Operationalsince 01/01/2014 • Meteo: GFS 50 km • Open Boundaryconditions: Mercator Ocean • Discharges: monthlyaveragesfrom 2012 data (notavailable real time data)
La Rochelleoperationalmodel http://forecast.maretec.org/maps_LaRochelle.asp
Modelvalidation • Validationperiod: • Jan 2012-Jun 2012 • Data used: • Waterlevel • Tidalanalysis • Temperature • Profiles • Satelliteimages • Salinity • ModelConfiguration: • Meteo: Meteofrance 3Km • Data assimilation: Mercator Ocean • Dailyfreshwater • RiverTemperaturewasderivedfromhistorical data
Waterlevel LA ROCHELLE LA PALLICE
Waterlevel ILE D’AIX
- PORT BLOC - ROYAN Waterlevel
Tidalanalysis (1) LA ROCHELLE LA PALLICE
Tidalanalysis (2) ILE D’AIX
Tidalanalysis (3) POINTE DE GRAVE PORT BLOC
Tidalanalysis (4) ROYAN
Vertical ProfilesComparison • Period: • May-Jun 2012 • Cruise: • Pelgas • Data Source: • MEDATLAS • Parameters: • Salinity • Temperature
TEMPERATURE PROFILES EXAMPLES Temperatureprofiles
ComparisonwithsatelliteimagesTemperatureDomain 2 Credits: Fernando Machado Francisco Campuzano
ComparisonwithsatelliteimagesTemperatureDomain 3 Credits: Fernando Machado Francisco Campuzano
ComparisonwithsatelliteimagesTemperatureDomain 3 Credits: Fernando Machado Francisco Campuzano
Salinity DOMAIN 2 2.5 km resolution (no freshwaterdischarges) DOMAIN 3 - 500 m resolution (withfreshwaterdischarges)
ComparisonSatellite-MOHID-Mercator OceanLevel 2 MohidsolutionisconsistentwithassimilatedsolutionfromMyOcean/Mercator Thecomparisonwith data shows that Mercator and as a consequence, MOHID havelowagreementwith data in June
Comparison Satellite-MOHID-Mercator Ocean Level 2 MohidsolutionisconsistentwithassimilatedsolutionfromMyOcean/Mercator Thecomparisonwith data shows that Mercator and as a consequence, MOHID havelowagreementwith data in June
Validationoutcomes • Waterlevelresultsshowed a goodagreementwith data • PeriodMay-June: Salinityprofileshadgoodagreementwith data • In May-junetemperatureresultshadlowagreementwith data. • Mercator-Ocean data assimilation • Imposedtemperature in theriver
Applicationofthemodel • Water Budget • Residence time ofwater
Waterbudgetin themain bivalves areas Bottomlayer Surfacelayer
Vertical waterfluxes Downward Upward
Bottomwaterrenewal • Spring scenario