Download
1 / 26
260 likes | 380 Views
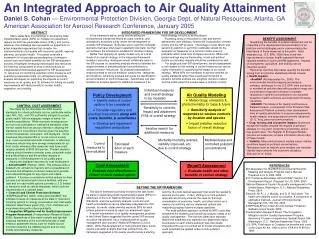
Recommended Strategy for an Integrated National Approach to EE. Presentation to the Parliamentary Portfolio Committee on Energy 6 September 2012. Energy Efficiency How are we Doing?. Score Card. SCORE Fact Base - Lacking Objectives - Arbitrary Strategy – None

E N D
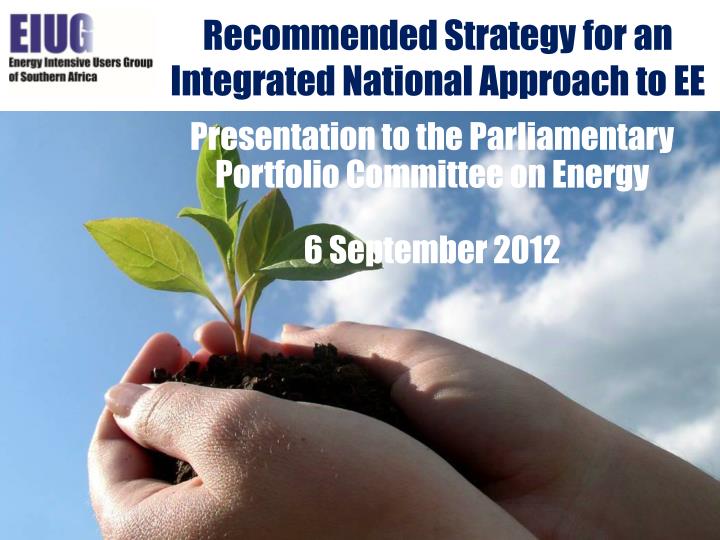
Recommended Strategy for an Integrated National Approach to EE Presentation to the Parliamentary Portfolio Committee on Energy 6 September 2012
Energy EfficiencyHow are we Doing? Score Card SCORE Fact Base - Lacking Objectives - Arbitrary Strategy – None Implementation – Ad - Hoc
Contents • Status: • Fact Base • Objectives • Strategy • Implementation • Solution
Growth: Economic & Jobs Requires more energy Source: ExxonMobil Outlook to 2040
Improved Standard of Living - Requires more energy Source: ExxonMobil Outlook to 2040
RSA - Usage per sector Energy & Demand Sources: Frost & Sullivan & Eskom
Myth Busting - “Industry is inefficient due to low electricity prices”.Industry have for a long time been working hard to reduce their energy intensity & will continue to do so
Need a Framework for Analysing Opportunity Specific Barriers
An example of “Addressing the barriers” in High Income Housing
5 Must Determine Potential: Probable, Doable & Most LikelyWithout serious economic Impact BACK UP
Residential and commercial: Potential savings levers and initiativesWithout serious economic Impact
Bottom Up Fact Base Required Detail required for residential sector household consumption(% contribution per end use) electricity consumption (% annual consumption) 17 83 kitchen appliances (cooking, laundry and cool storage) lighting residential all other sectors 28 18 4 other water heating losses maximum demand(% maximum demand) 35 65 30 15 5 residential all other sectors (Source: DSM Sector Analysis, 2007. Residential demand: 13,908MW, Residential consumption: 46,402 GWh)
And then by sector Type technologies and end uses varies across market segments Market segment 2(~58% of households) Market segment 3 (~21% of households) Market segment 1 (~21% of households) LSM 8 – 10(number of appliances) LSM 4 - 7(number of appliances) 6.8 m 44.4 m 54.1 m 1.8 m 5.5 m 10.7 m LSM 1 – 3(number of appliances) 0.2 m 3.2 m 4.1 m - 0.8 m 0.09 m 0.9 m 5.0 m 6.5 m - 2.4 1.2 m 3.2 m 11.2 m 22.1 m 0.1 m 2.4 m 2.4 m lighting televisions Kitchen appliances Motors geysers Pool pumps Fans HVAC (heating and cooling) (Source: Frost and Sullivan Market Analysis for Residential market 2012
Contents • Status: • Fact Base • Objectives • Strategy • Implementation • Solution
Objective Setting An Iterative Process to find the right target in time Actual Consumer Energy Usage Compressible over time Best in Class Best Known Technology Not Compressible Theoretical Best
Contents • Status: • Fact Base • Objectives • Strategy • Implementation • Solution
Contents • Status: • Fact Base • Objectives • Strategy • Implementation • Solution
2012 2013 2014 Urgent Next Steps Jun Aug Sept Dec Jan Apr Jun Aug Sept Dec Jan Apr Jun Aug Sept Dec Indicative only Still to be agreed Project Plot Base line Emissions 1990 - 2010 and Inventory 2011 Plot the Three Emissions Outlook 2012 to 2050 Flagship Abatement Program Develop and Agree GHG Data MRV Meta System Develop National Reporting System (NEIS) "MRV" Define Regulated Entities (Unique Generic Significant Activities) Plot Macro Abatement Potential (Top Down) Develop Sector Abatement Potential (Bottom Up) Identify Assess Policy Suite Options Assess and Select Policy Suite Options Risk Assessments and Plans as Required Develop South Africa Abatement Potential Finalise Activity/Sector GHG Allocations Finalise South Africa’s Draft 1ST Country Budget 1st Pass Country 2050 Scenarios - Transitioning to a Low Carbon Economy EE Road Map(Example Carbon Budgeting
Contents • Status: • Fact Base • Objectives • Strategy • Implementation • Solution
Simultaneous Top Down & Bottom up Top Down Country Base Line Past Savings Opportunities Sector Base Line Past Savings Opportunities Bottom up Facility Base Line Past Savings Opportunities Services Base Line Past Savings Opportunities
Policy Integration CAMCO: Interaction between EE objectives and wider national development plans