Download
1 / 11
110 likes | 213 Views
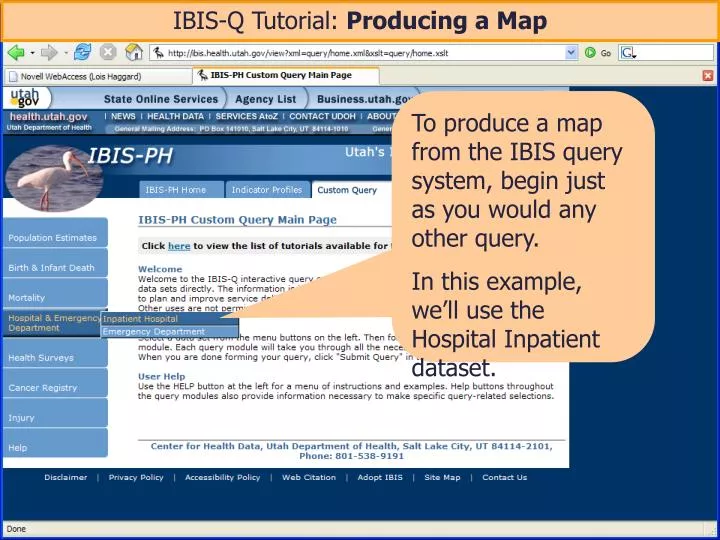
IBIS-Q Tutorial: Producing a Map. To produce a map from the IBIS query system, begin just as you would any other query. In this example, we’ll use the Hospital Inpatient dataset. County/LHD versus Small Area geography options use different query-builder pages.

E N D
IBIS-Q Tutorial: Producing a Map To produce a map from the IBIS query system, begin just as you would any other query. In this example, we’ll use the Hospital Inpatient dataset.
County/LHD versus Small Area geography options use different query-builder pages. In this example, we have drilled-down in the Small Area folder. IBIS map options are always under the “Advanced Selection” area.
The context-specific help buttons describe the two types of maps currently available.
Use the query-builder steps to define your query, just as you would for any other query.
Query selections for this analysis include Asthma hospitalizations for children age 0-17 for a three-year period.
To get full functionality from the map feature, you will need the Adobe SVG Viewer installed on your computer. (SVG installation instructions may be accessed from the IBIS Site Map, in the footer of every IBIS web page.)
You can turn map layers, such as roads and lakes, on or off using these check boxes. The map legend describes how to interpret the map colors.
If you hover over an area with your cursor, IBIS will display information about that area.
Click-and-drag the Active View Control tool to view different areas of the map.
The IBIS map results also include the detailed data list information underneath the map.