Download
1 / 45
450 likes | 547 Views
Family Changes: Policy Implications for Social Security and Long-Term Care. Yung-Ping Chen, PhD Frank J. Manning Eminent Scholar's Chair in Gerontology Gerontology Institute University of Massachusetts, Boston Co-sponsored by: Center on the Family, University of Hawaii, Manoa

E N D
Family Changes: Policy Implications for Social Security and Long-Term Care Yung-Ping Chen, PhD Frank J. Manning Eminent Scholar's Chair in Gerontology Gerontology Institute University of Massachusetts, Boston Co-sponsored by: Center on the Family, University of Hawaii, Manoa Executive Office on the Aging, State of Hawaii Women’s Caucus of the Hawaii State Legislature State Capitol, Room 309, June 22, 2004, 9:00-11:00AM
Changes in Social Trends (1970-2000) 19702000 • Female Labor Force Participation Rate42% 58% • Divorced (% of adults) 3% 9.9% • Unmarried adults 38 mil 87 mil • Never-married adults (% of all adults) 16% 24%
Marriage Delayed or Avoided:Japanese Young People are Delaying or Avoiding Marriage. JAPAN USA Sources: U.S. Census: Japanese Ministry of Public Management, Home Affairs, Posts and Telecommunications.
Divorce is rising: Japan’s divorce rate is up sharply over the past decade, thought it’s still well below the U.S. rate 2.30 1.28 Sources: Japanese Ministry of health, labor and Welfare: Japanese Institute of Global Communications
Declining Percentages of Married Adults (1970-2000) • 15% drop among whites, from 73% to 62% • 36% drop among blacks, from 64% to 41% • 18% drop among Hispanics, from 72% to 59%
Increase in Never-Married Persons (1970-2000) • 31% increase (from 16% to 21%) for whites • 86% increase (from 21% to 39%) for blacks • 53% increase (from 19% to 29%) for Hispanics
Proportions of New Beneficiariesa as Retired Workers, Disabled Workers,and Dependents and Survivors,b in Selected Years (1970–2010) Notes: a New beneficiaries refer to those awarded benefits in each year. b Dependents and survivors include wives/husbands, children, widowers, widowed mothers/fathers, and parents. c For 1970–97, calculations based on data in Table 6.A (OASDI Benefits Awarded: Summary ), 1998 Statistical Supplement to the Social Security Bulletin, Social Security Administration, SSA Publication No. 13-11700, p. 254. For 2010, calculations based on unpublished estimates supplied by the Office of the Chief Actuary, Social Security Administration, Feb. 1 and Feb. 13, 2002.
Poverty Rates among Older Women (1999) • Married 4.3% • Widowed 15.9% • Divorced 20.4% • Never married 18.9%
Some Proposals • Raise survivor benefit and lower spousal benefit • Raise survivor benefit • Lower length of marriage • Implement earnings sharing • Provide minimum benefit
Caveats in Policy Development • Employment-based income replacement • Income deficiency outside Social Security
Reasons for Low Income at Widowhood • Pre-widowhood income differential (20-26%) • Decline in Social Security benefit (40-50%) • Decline in pension income (15%) • Decline in other asset income (10-15%)
Two-Tier Benefit Structure • First-tier benefit • Flat rate • Eligibility based on age or disability • General revenue financing • Second-tier benefit • Earnings-related benefit • Earnings sharing • Payroll tax financing
Funding Long-Term Care: Applications Of The Trade-Off Principle In Both Public And Private SectorsorAn Intragenerational Funding Model for Long-Term Care
LIFE EXPECTANCY AT BIRTH AND AT AGE 65 Source: 1996 Social Security Trustees Report, p.61.
Average Life Expectancy at Age 65 (U.S.) • Historical • 1940: 12.6 years • 2000: 17.5 years • Intermediate Projection • 2030: 18.9 years • 2050: 20.1 years
Life Expectancy in Hawaii and in U.S. Source: Hawaii Department of Health, Office of Health Status Monitoring. /1 Centers for Disease Control and Prevention, National Center for Health Statistics.
Census Bureau Estimates of Number of Elderly Individuals in 1997, 2030, and 2050
Older Populations (65+ and 85+) As Percent of Total Population Source: U.S. Census Bureau, Hawaii data. /1 Hawaii Department of Business, Economic Development and Tourism, Research and Economic Analysis Division, DBEDT 2025 Series, Population and Economic Projections for the State of Hawaii 2025, February 2000.
Comparison of Percent Increase in Population Source: U.S. Census Bureau, Hawaii data.
Many 65+ Have at Least One Disability Source: U.S Census Bureau, Census 2000, Hawaii data.
Need for Assistance with Personal Care Increases with Age Age Group Source: Hawaii Department of Health, Office of Health Status Monitoring, Hawaii Health Survey 2000.
Percent 60+ Diagnosed with Diabetes (1994-2001) Source: Hawaii Department of Health, Community Health Division, Behavioral Risk Factor Surveillance System.
Percent 60+ Diagnosed with High Blood Pressure Source: Hawaii Department of health, Community Health Division, Behavioral Risk Factor Surveillance System.
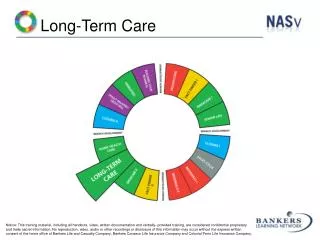
Defining Long-Term Care • Medical, nursing, social, and personal services • At home, in the community, or in an institution • Extended period of time • Functional impairment (activities of daily living—ADLs) • Bathing • Dressing • Eating • Transferring • Toileting • Continence • Cognitive Impairment
Types of Long-Term Care • Informal (non-paid)—family and friends • Formal (paid)—professional providers
Reasons for Less Informal Care • Geographic dispersion of family members • More women working in paid labor force • Smaller families • fewer children per family • more childless families • higher divorce rates • more single-parent families • Impairments of adult children themselves
Tests for Insurability of a Risk • Involuntary risk • Economic loss incurred • Verifiable risk • Law of large numbers • Contingency falling on a small proportion at one time • Predictable risk
Long-Term Care as an Insurable Risk • Need for LTC • predictably small proportion of population • costs may be substantial or even catastrophic • Risk pooling limits an individual’s financial exposure • Insurance in private and public sectors
Present Pattern of Funding in the U.S. • Out of pocket (personal savings) • Medicaid (public welfare) • Medicare (social insurance) • Private insurance
Formal Long-Term Care Expenditures for the Elderly, 2000 Source: Based on projections in Congressional Budget Office (2000).
Formal Long-Term CareExpenditures for the Elderly, 2000Public and Private Sectors Combined
Formal Long-Term CareExpenditures for the Elderly, 2000Public Sector
Formal Long-Term CareExpenditures for the Elderly, 2000Private Sector
Impediment to Social and Private Insurance Programs • Competition for funds • Social insurance vs. general health, education, welfare, and other expenditures • Private insurance vs. other consumption outlays
Lack of Penetration by Private Insurance: Demand Factors • High costs • “Use it or lose it” • Exclusions (the “fine print” problem) • Can self-insure • Rely on public welfare (Medicaid) • Procrastination • Uninsurable • Will never need it • Long lapse of time between sales/purchase and use
Lack of Penetration by Private Insurance: Supply Factors • Moral hazard (greater use of services induced by insurance) • Adverse selection (buyers are those who “know” they will likely need LTC services) • Problems for the sales force • Long lapse of time between sales/purchase and use
Guiding Principles for LTC Funding • Insurance in public and private sectors • The trade-off principle
Sharing Public and Private Responsibility: A three-legged stool approach • Retirement income • Acute health care • Long-term care
A Three-legged Stool Approach: Retirement Income • Social insurance as a floor of protection • Employment-based (occupational) pensions as supplement • Personal savings as supplement • [ Public assistance as safety net when three legs prove insufficient ]
A Three-legged Stool: Acute Health Care • Medicare • Employer-provided health benefits • Medicare Supplemental (Medigap) policies • [ Medicaid as a safety net for the poor ]
Estimated revenue for the proposed Long-Term Care (LTC) Trust Fund in first 5 years of operation (no disbursements) (All dollar amounts are in billions) Note: OASDI benefits and interest rates are those projected under the alternative II (intermediate) assumptions in the 1993 Annual Report of the Trustees.
Measures of Solvency for Social Security, 1991-2004 Intermediate Assumptions
Measures of Solvency for Social Security, 1991-2004 Intermediate Assumptions