Download
1 / 26
260 likes | 446 Views
SharePoint Saturday DC 2014 Correlation or Bust? Tips and Tricks for Troubleshooting SharePoint 2010/2013. By: Toby McGrail Sr. Software Engineer. Housekeeping…. Remember to fill out session and event evaluations… Phasers set to stun, mobile devices set to silent…

E N D
SharePoint Saturday DC 2014 Correlation or Bust? Tips and Tricks for Troubleshooting SharePoint 2010/2013 By:Toby McGrailSr. Software Engineer
Housekeeping… • Remember to fill out session and event evaluations… • Phasers set to stun, mobile devices set to silent… • You must be present to win at the wrap-up…
Join us at #SharePint sponsored by Metalogix at Clyde’s of Chevy Chase in the RaceCar Bar Downstairs Why? To network with fellow SharePoint professionals What? SharePint!!! When? 5:30 PM Where? RaceCar Bar Downstairs 5441 Wisconsin Ave Chevy Chase, MD 20815 Thanks to? Metalogix!
Agenda • Introduction • What are Correlation IDs? • Diagnostic Logging • Usage and Health Data Collection • Health Analyzer • Developer Dashboard • Crawl Logs • Monitoring • Custom Pages • IIS App Pools and Sites • Counters and Thresholds • Performance • Network • Client/Browser Issues • Tools • PowerShell Commands • Wrap Up • Questions?
Introduction • Toby McGrail – Senior SharePoint Engineer for Microlink LLC – An HP Company. 8 Years SharePoint Experience • Outside of SharePoint I have balanced lifestyle that includes my family, friends, and Fitness. Fitness and SharePoint are my passion. • Over 20 years IT Experience
What is a Correlation ID? Correlation Ids are GUIDs assigned to events which transpire during the lifecycle of a resource request. As problems occur, the Correlation Id is commonly surfaced within the context of an error when presented to the person initiating the request or through the Developer Dashboard. • You may have seen a message like the ones below in SharePoint 2010 or 2013 SharePoint 2010 SharePoint 2013
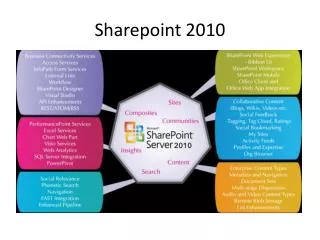
Diagnostic Logging - Overview • The primary goal of monitoring is to ensure a healthy SharePoint Environment so that you can achieve service performance objectives such as short response time. • You can use the monitoring features from the SharePoint Central Administration and PowerShell scripts to monitor the SharePoint Environment and services. • Logs and reports track SharePoint Environment and service status. • You can read the logs from the logging database. The advantage of using logging database is that you can configure your view and export the logs to Excel. • The logs and reports from Central Administration help you understand how the SharePoint 2013 system is running, analyze and repair problems, and view metrics for the sites. • Log Levels • Trace Logs • Event Throttling
Log Levels – Event Logging • it is important that you choose an appropriate severity level. The severity level of an event is displayed in the Windows Event Log and is used by administrators and registered by monitoring tools to indicate how severe or important an event is. Choosing an appropriate level is a key part of the health and monitoring design for your component or system. • Now to the Levels • Critical Error - Events that demand the immediate attention of the system administrator. They are generally directed at the global (system-wide) level, such as System or Application. They can also be used to indicate that an application or system has failed or stopped responding. • Error - Events that indicate problems, but in a category that does not require immediate attention. • Warning -Events that provide forewarning of potential problems; although not a response to an actual error, a warning indicates that a component or application is not in an ideal state and that some further actions could result in a critical error. • Information - Events that pass noncritical information to the administrator, similar to a note that says: "For your information.“ • Verbose - Verbose status, such as progress or success messages.
Log Levels – Trace (ULS) Logging • When writing a trace log by using the ULS API, you must specify a severity level. The severity level is displayed in the ULS trace log and is commonly used by reporting or filtering tools. For this reason, it is important to choose an appropriate level. • Now to the Levels • Unexpected - Similar to an Assert (an assumption in code that a condition is true at a particular point), this message indicates that a logic check failed that is atypical, or the message returns an unexpected error code. These generally represent code bugs that should be investigated and fixed. • Monitorable - Traces that indicate a problem, but do not need immediate investigation. The intent is to collect data and analyze it over time, looking for problem trends. • High - General functional detail, the high priority events that happen in the environment. Examples include global configuration modifications, service start and stop, timer jobs completed, and so on • Medium - Useful to help support or test teams debug customer or environmental issues. These likely include messages indicating that individual features have succeeded or failed, such as creating a new list, modifying a page, and so on. • Verbose - Useful primarily to help developers debug low-level code failures. Not generally useful to anyone who does not have access to source code or symbols. Most event tracing that does not need to be enabled all the time should be set at the Verbose level.
Usage and Health Data Collection • SharePoint stores Usage and Health Information in Files and in a Database. • Consumes disk space and has a huge effect on Performance. Remember that these files can fill up server space if not configured correctly. Always remember to set a limit and don’t make it unlimited or you will see your disk space disappear rapidly • Something that needs to be managed closely and includes: • Health Data Collection – Lots of timer jobs to monitor and maintain • Log Collection – Timer Job to copy events from files into the Database
Health Analyzer • Identifies possible problems and gives the Farm Admin Possible solutions • Some of the Solutions have the Repair Now however in most cases they don’t work or are not “Best Practices” • Applies a set of rules that can be extended or in most Environments customized to the needs of the Farm • Rules are applied for some of the following categories • Security • Performance • Configuration • Availability • Timer Jobs perform these monitoring tasks and collect the monitoring data • Some of these notifications are not always helpful but more time consuming than anything else • Some of the alerts however are also very useful in finding potential issues that you would only find by monitoring the ULS Logs
Developer Dashboard • Don’t be fooled by the name its more a tool to help you troubleshoot problems and performance issues • Easily Troubleshoot Problems with Page Rendering • Three Types of modes that you need to be aware of • Off - Not Displayed • On – Rendering on Each and Every Page • OnDemand – Hidden until you manually click on the Developer Dashboard Icon • Granular Control on Visibility provided – Users that have Customization permissions by default • Great way to Monitor Custom Code when the Developer uses the SPMonitoredScope Tag – It’s a great idea to make your solutions use this tag. • Use PowerShell to enable DD. • $ds= [Microsoft.SharePoint.Administration.SPWebService]::ContentService.DeveloperDashboardSettings$ds.DisplayLevel = 'OnDemand'$ds.TraceEnabled = $true$ds.Update()
Developer Dashboard • There are 6 report sections which provide you with lots of stats and data • .
Crawl Logs • Only visible within the Central Administration Site • Relies on Crawl Log for Search Application • Important to Monitor this log regular so that your crawl is effectively crawling all the content • Remember to Look for Top Level Errors and fix them immediately • Top Level documents especially start addresses • Virtual Servers • Content DB
Monitoring • HTTP “Ping is a useful command but doesn’t help when troubleshooting • Remember SharePoint implements custom error messages. (AKA the Correlation ID error message or the 2013 Error Message (Working on it) • Most common error codes 404 and 401 can be hidden • Develop a page that checks SharePoint Services
Custom Pages • Create Custom Pages to allow for more in depth logging. • Example HTTP Throttling for Performance Issue • Custom Error Page to help Admin and Support with user with important data • Corraleation ID • Web Front End Server • Time of Error • User affected • Log Name
IIS App Pools and Sites • Common Issues with SharePoint App Pools • IIS Resets not done correctly • No Recycling or Restarting of App Pools • IIS Website is stopped • Create Task to have App Pools recycled daily and restarted once a week. Also have them restart automatically • IIS Logging to see why App Pools and Sites have stopped or is not responding.
Counters and Thresholds • Processor Utilization – Not to exceed 80 Percent but ideally under 50 Percent • Available Memory – Greater then 10 Percent • Disk Latency Less then 25 MS but ideal situation is 15 MS • SQL Server is more like 10 MS
Network Troubleshooting • SharePoint is Fast on Server but slow on client • Slow only across VPN Clients • Slow on Server and Client. Communication Issue with SQL Server is most likely the issue • Networking Tools • Microsoft Network Monitoring • Wireshark
Client/Browser Issues • Is the issue across the network or just one or very few users experience the issues • Make sure that all clients are at Organization approved browser level • SharePoint relies heavily on JavaScript • Older Browser deliver poor user adoption and/or support • IE9 and IE10 are much faster and more reliable • Firefox Version 5 or later. Not all SharePoint features work in Firefox
Tools • SharePoint Management Console • Wireshark • SPDiag • Developer Dashboard • PAL – Performance Analysis of Logs • SharePoint Diagnostic Studio • Fiddler • Performance Monitor • ULS Viewer
PowerShell Commands • When running updates don’t use the GUI use PowerShell • PSConfig.exe -cmd upgrade -inplace b2b -force -cmd applicationcontent -install -cmd installfeatures • Configure ULS and Data Collection through PowerShell • Set-SPDiagnosticConfig -LogLocation D:\DiagnosticLogs • Set-SPDiagnosticConfig –LogMaxDiskSpaceUsageEnabled • PowerShell should be your best friend. Its faster and more reliable. Create custom script files to save you time. • Example –Restart SPServices – Custom solution we have built to restart all SharePoint services throughout farm
Wrap Up • Know your Environment – Troubleshooting starts here! • Performance Baselines help detect and limit issues and problems • Monitoring is the Key! • Pay attention to Log Files – Both Event and ULS Logs. ULS Viewer should become your best friend next to PowerShell. • Tools • SPDiag – Helps Troubleshooting SharePoint • PAL – Helps with Server Health • Diagnose one issue at a time!
Questions • Do you have any issues that you have seen that we have not covered • My Blog • http://tobymcgrail.com:2020/SPADMIN • References • PAL – http://pal.codeplex.com • SharePoint Diagnostic Studio -http://technet.microsoft.com/en-us/library/hh144782.aspx • TechNet • Contact Information: • Toby McGrail – toby@sptoby.com