Download
1 / 121
1.22k likes | 1.37k Views
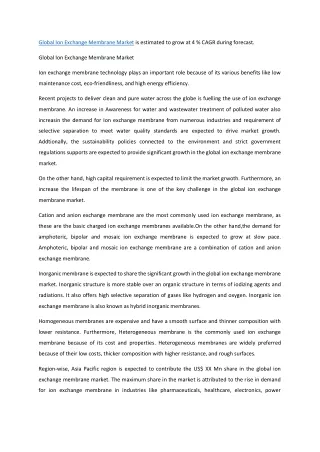
In the past six years, VRB ion exchange membrane market showed rapid expansion of the trend. From 2011 to 2016, VRB ion exchange membrane production increased by 7.3 times. In 2016, the global production was 16509 Sq.m. The global market was valued at $ 6.50 million in 2016.

E N D
2017 Market Research Report on Global Ion Exchange Membrane ofAll-Vanadium Redox Flow Battery Industry 2017 Market Research Report on Global Ion Exchange Membrane of All-Vanadium Redox Flow Battery Industry For The Global Market Status and Outlook, from 2012 to 2022 Hard Copy: 2900 USD PDF Copy (single user): 2900 USD Enterprise wide License: 5800 USD
2017 Market Research Report on Global Ion Exchange Membrane ofAll-Vanadium Redox Flow Battery Industry Pages: 126 Tables and Figures: 124 Published Date: May 2017 Publisher: QYR Chemical & Material Research Center Contact Details: Tina Ning Email: tinaning@qyresearch.com Web: http://www.qyresearcheurope.com/ Web: http://www.qyresearchglobal.com/ Web: http://www.qyresearchjapan.com/ Web: http://qyresearch.com/ QYResearch covers the prevailing industry, including fine chemicals, advanced materials, automotive and transportation, food and beverages, pharmaceuticals, medical devices, semiconductor and electronic components, consumer electronics and household appliances, energy and power, industrial automation, mining, minerals and metals, agriculture and feed, building and construction. Summary In the past six years, VRB ion exchange membrane market showed rapid expansion of the trend. From 2011 to 2016, VRB ion exchange membrane production increased by 7.3 times. In 2016, the global production was 16509 Sq.m. The global market was valued at $ 6.50 million in 2016.
2017 Market Research Report on Global Ion Exchange Membrane ofAll-Vanadium Redox Flow Battery Industry Source: Annual Reports, Secondary Information, Press Releases, Expert Interviews and QYResearch, May 2017 Geographically, this report is segmented into several key Regions, with production, consumption, revenue, market share and growth rate of Ion Exchange Membrane of All-Vanadium Redox Flow Battery in these regions, from 2012 to 2022 (forecast), covering United States EU China Japan SoutheastAsia India South America Middle East andAfrica The major players in global Ion Exchange Membrane of All-Vanadium Redox Flow Battery market include Chemours (DuPont), FuMa-Tech, Golden Energy Fuel Cell, Dalian Institute of Chemical Physics. On the basis of product, the Ion Exchange Membrane of All-Vanadium Redox Flow Battery market is primarily split into Full-fluorinion Ion Exchange Membrane Non-fluorinion Ion Exchange Membrane Table Ion Exchange Membrane of All-Vanadium Redox Flow Battery Production (K Units) and Revenue (Million USD) Market Split by Product Type
2017 Market Research Report on Global Ion Exchange Membrane ofAll-Vanadium Redox Flow Battery Industry Market Segment by Type 201 6 XX 201 7 XX 201 8 XX 201 9 XX 202 0 XX 202 1 XX 202 2 XX Full-fluorinion Membrane -Change (%) Non-fluorinion Membrane -Change (%) Total -Change (%) Source: Secondary Literature, Press Releases, Expert Interviews and QYResearch, May 2017 Ion Exchange xx% XX xx% XX xx% XX xx% XX xx% XX xx% XX xx% XX Ion Exchange xx% XX xx% xx% XX xx% xx% XX xx% xx% XX xx% xx% XX xx% xx% XX xx% xx% XX xx% On the basis on the end users/applications, this report covers Renewable Power Supply Industrial Grid(Excluding Renewable Power)Adjustment and Management Others Table Ion Exchange Membrane of All-Vanadium Redox Flow Battery Consumption (K Units) by Application (2016-2022) 20 12 20 16 20 22 Mark et Share (%)2 022 xx% Growth Rate (2016-20 22) Renewable Power Supply X X X X X X X X X X X X X X X X X X X X X X X X xx% Industrial Adjustment and Management Others Grid(Excluding Renewable Power) xx% xx% xx% xx% Total 100% xx% Source: Secondary Literature, Press Releases, Expert Interviews and QYResearch 1 Methodology/ResearchApproach This research study involved the extensive usage of both primary and secondary data sources. The research process involved the study of various factors affecting the industry, including the government policy, market environment, competitive landscape, historical data, present trends in the market, technological innovation, upcoming technologies and the technical progress in related industry, and market risks, opportunities, market barriers and challenges. The following illustrative figure shows the market research methodology applied in this report.
2017 Market Research Report on Global Ion Exchange Membrane ofAll-Vanadium Redox Flow Battery Industry 1.1 Research Programs/Design Table Research Programs/Design for This Report Research Design Industry Trends Global Market Size (Volume and Value); Status and Outlook; Competitive Landscape By Manufacturers; Expansion; Mergers Acquisitions Volume and Value for Major Players Market Share Growth Rate Present Situation Analysis; Historical Data (2012-2016) and Market Segment By Types By Applications By Regions/ Geography Volume and Value Market Share Growth Rate Present Situation Analysis Market Environment Government Policy Technological Changes Market Drivers Growing Demand of Downstream Reduction in Cost Influencing Factors Market Risks Market Opportunities and Challenges Market Size Forecast Global Overall Size By Type/Product Category By Applications/End Users By Regions/Geography Key Data Market Size (Volume and Value); Market Share Growth Rate Growth Rate Market Forecast (2017-2022)
2017 Market Research Report on Global Ion Exchange Membrane ofAll-Vanadium Redox Flow Battery Industry 1.2 Market Size Estimation Top-down and bottom-up approaches are used to validate the global Ion Exchange Membrane of All-Vanadium Redox Flow Battery market size market and estimate the market size for manufacturers, regions segments, product segments and applications (end users). The market estimations in this report are based on the marketed sale price of Ion Exchange Membrane of All-Vanadium Redox Flow Battery (excluding any discounts provided by the manufacturer, distributor, wholesaler or traders). The percentage splits, market shares, and breakdowns of the product segments are derived on the basis of weightages assigned to each of the segments on the basis of their utilization rate and average sale price. The regional splits of the overall Ion Exchange Membrane of All-Vanadium Redox Flow Battery market and its sub-segments are based on the percentage adoption or utilization of the given product in the respective region or country. Major players in the market are identified through secondary research and their market revenues determined through primary and secondary research. Secondary research included the research of the annual and financial reports of the top manufacturers; whereas, primary research included extensive interviews of key opinion leaders and industry experts such as experienced front-line staff, directors, CEOs and marketing executives. The percentage splits, market shares, growth rate and breakdowns of the product markets are determined through using secondary sources and verified through the primary sources. All possible factors that influence the markets included in this research study have been accounted for, viewed in extensive detail, verified through primary research, and analyzed to get the final quantitative and qualitative data. The market size for top-level markets and sub-segments is normalized, and the effect of inflation, economic downturns, and regulatory & policy changes or other factors are not accounted for in the market forecast. This data is combined and added with detailed inputs and analysis from QYResearch and presented in this report. The following figure shows an illustrative representation of the overall market size estimation process used for this study.
2017 Market Research Report on Global Ion Exchange Membrane ofAll-Vanadium Redox Flow Battery Industry Figure Bottom-up and Top-downApproaches for This Report Total Global Market Size (Volume and Value) Share of Companies’ Revenue and Volume in Each Product Segment Market Share Splits by Type; Regions Uptake of the Market, by End Users/ Application Regional and Country-wise Market for Each subsegment Company-wise Revenue in the Global Market Bottom-up Approach: Market data information Collection and analysis, through Primary Sources and Secondary Sources; Top-downApproach: Global Market Size is validated through Primary Sources and Secondary Sources; Primary Sources: Demand-side Experts Supply-side Experts Secondary Sources: Annual Reports Presentations Press Releases Journals Paid Databases QYResearch Repository Primary Sources: Demand-side Experts Supply-side Experts Secondary Sources: Annual Reports Presentations Press Releases Journals Paid Databases QYResearch Repository 1.3 Market Breakdown and Data Triangulation After complete market engineering with calculations for market statistics; market size estimations; market forecasting; market breakdown; and data triangulation, extensive primary research was conducted to gather information and verify and validate the critical numbers arrived at. In the complete market engineering process, both top-down and bottom-up approaches were extensively
2017 Market Research Report on Global Ion Exchange Membrane ofAll-Vanadium Redox Flow Battery Industry used, along with several data triangulation methods, to perform market estimation and market forecasting for the overall market segments and sub segments listed in this report. Extensive qualitative and further quantitative analysis is also done from all the numbers arrived at in the complete market engineering process to list key information throughout the report. Figure Data Triangulation Primary Sources Secondary Sources Interviews With: Manufacturers Distributor Opinion Leaders Industry Experts Front-line Staff Directors CEO Marketing Executives Technology Innovation Directors Executives from Related Industries Organizations Annual Reports Presentations Press Releases Journals Paid Databases QYResearch Repository Supply Side and and Interviews With: Purchasing/Product Managers End Users/Buyers Industry Experts Opinion Leaders Research Institutes TRADING ECONOMICS Federal Economic Data Bloomberg Business Hoovers Factiva Demand Side Reserve Key Manufacturers Market Analysis by Product Category Market Forecast Source Competitive Landscape Market Analysis by Regions Market Estimates Market Share (%) and Market Analysis by End Users /Applications Risks, Opportunities and Growth Rate Challenges 2 Data Source 2.1 Secondary Sources Secondary Sources occupiesApproximately 25% of Sources, such as press releases, annual reports, Non-Profit organizations, industry associations, governmental agencies and customs data, and so on; This research study involved the usage of widespread secondary sources; directories; databases such as Bloomberg Business, Wind Info, Hoovers, Factiva (Dow Jones & Company),
2017 Market Research Report on Global Ion Exchange Membrane ofAll-Vanadium Redox Flow Battery Industry TRADING ECONOMICS, and avention; Investing News Network; statista; Federal Reserve Economic Data; annual reports; BIS Statistics; ICIS; company house documents; CAS(American Chemical Society); investor presentations; and SEC filings of companies. Secondary research was used to identify and collect information useful for the extensive, technical, market-oriented, and commercial study of the Ion Exchange Membrane of All-Vanadium Redox Flow Battery market. It was also used to obtain important information about the top players, market classification and segmentation according to industry trends to the bottom-most level, and key developments related to market and technology perspectives. Table Key Data Information from Secondary Sources Parameters Key Data Sources Market Size Segmental Revenue Journals, Websites, and Press Releases Annual Reports and SEC Filings Company Websites and Press Releases Public and Paid Databases QYResearch Data Repository Geographic Penetration Product Adoption Rate For Different End Users Product Pricing Market Position Top Players Product Financials of Geographic Revenue Mix Total Company Revenue Business/Segmental Revenue Mix Qualitative Analysis Influence Factors Company Websites and Press Releases Public and Paid Databases Annual Reports Industry Associations QYResearch Data Repository Market Potential Market Risks and Opportunities Industry Trends Geographical Features Government Policies 2.2 Primary Sources In the primary research process, various sources from both the supply and demand sides were interviewed to obtain qualitative and quantitative information for this report. The primary sources from the supply side include product manufacturers (and their competitors), opinion leaders, industry experts, research institutions, distributors, dealer and traders, as well as the raw materials suppliers and producers etc. The primary sources from the demand side include industry experts such as business leaders, marketing and sales directors, technology and innovation directors, supply chain executive, end users (product buyers), and related key executives from various key companies and organizations operating in the global market. Primary research was conducted to identify segmentation types, product price range, product
2017 Market Research Report on Global Ion Exchange Membrane ofAll-Vanadium Redox Flow Battery Industry applications, key players, raw materials supply and the downstream demand, industry status and outlook, and key market dynamics such as risks, influence factors, opportunities, market barriers, industry trends, and key player strategies. Table Key Data Information from Primary Sources Primary Sources Parameters Key Data Production, Revenue and Market Share of Product Types Market Size by Product Types, Status and Outlook By Types Product Production, Revenue and Growth Rate of Product Types Market Segments Consumption of Product in Major Applications By Applications (End Users) Market Data by Applications/End Users, Status and Outlook Percentage and Growth Rate of Each Application Production, Growth Rate and Market Share by Regions Market Segments by Regions Market Data by Regions, Status and Outlook Revenue, Growth Rate and Market Share by Regions Consumption, Market Share by Regions Growth Rate and Global Forecast (2012-2022) Market Size Status and Global Present Forecast Overall Situation Size, and Global Market Global Forecast (2012-2022) Market Size Status and 3 Disclaimer The information and opinions in this report were prepared by QYResearch. The information herein is believed to be reliable and has been obtained from authentic public sources. QYResearch research and analysis services are limited publications containing valuable market information provided to a select group of customers in response to orders. Our customers acknowledge, when ordering, that QYResearch research and analysis services are for our customers’ internal use and not for general publication or disclosure to third parties. Quantitative market information is based primarily on interviews and therefore, is subject to fluctuation. QYResearch does not endorse any vendors, product or service depicted in their research publications. QYResearch research and analysis publications consist of the opinions of QYResearch’s research and should not be construed as statements of fact. QYResearch disclaims all warranties, expressed or implied, with respect to this research, including any warranties of merchantability or fitness for a particular purpose.
2017 Market Research Report on Global Ion Exchange Membrane ofAll-Vanadium Redox Flow Battery Industry QYResearch takes no responsibility for any incorrect information supplied to us by manufacturers or users. All trademarks, copyrights and other forms of intellectual property belong to their respective owners and may be protected by copyright. Under no circumstance may any of these be reproduced in any form without the prior written agreement of their owner. No part of this strategic analysis service may be given, lent, resold or disclosed to non-customers without written permission. Reproduction and/or transmission in any form and by any means including photocopying, mechanical, electronic, recording or otherwise, without the permission of the publisher are prohibited.
2017 Market Research Report on Global Ion Exchange Membrane ofAll-Vanadium Redox Flow Battery Industry Table of Contents 2017 Market Research Report on Global Ion Exchange Membrane of All-Vanadium Redox Flow Battery Industry 1 Methodology/Research Approach 1.1 Research Programs/Design 1.2 Market Size Estimation 1.3 Market Breakdown and Data Triangulation 2 Data Source 2.1 Secondary Sources 2.2 Primary Sources 3 Disclaimer 1 Ion Exchange Membrane ofAll-Vanadium Redox Flow Battery Market Overview 1.1 Product Overview and Scope of Ion Exchange Membrane of All-Vanadium Redox Flow Battery 1.2 Ion Exchange Membrane of All-Vanadium Redox Flow Battery Segment by Types (Product Category) 1.2.1 Global Ion Exchange Membrane of All-Vanadium Redox Flow Battery Production (K Units) and Growth Rate (%) Comparison by Types (Product Category) (2012-2022) 1.2.2 Global Ion Exchange Membrane of All-Vanadium Redox Flow Battery Production Market Share (%) by Types (Product Category) in 2016 1.2.3 Full-fluorinion Ion Exchange Membrane 1.2.4 Non-fluorinion Ion Exchange Membrane 1.3 Global Ion Exchange Membrane of All-Vanadium Redox Flow Battery Segment by Applications 1.3.1 Global Ion Exchange Membrane of All-Vanadium Redox Flow Battery Consumption (K Units) Comparison byApplications (2012-2022) 1.3.2 Renewable Power Supply 1.3.3 Industrial Grid(Excluding Renewable Power) Adjustment and Management 1.3.4 Others 1.4 Global Ion Exchange Membrane of All-Vanadium Redox Flow Battery Market by Regions (2012-2022) 1.4.1 Global Ion Exchange Membrane of All-Vanadium Redox Flow Battery Market Size and Growth Rate (%) Comparison by Regions (2012-2022) 1.4.2 North America Ion Exchange Membrane of All-Vanadium Redox Flow Battery Status and Prospect (2012-2022) 1.4.3 China Ion Exchange Membrane of All-Vanadium Redox Flow Battery Status and Prospect (2012-2022) 1.4.4 Europe Ion Exchange Membrane of All-Vanadium Redox Flow Battery Status and Prospect (2012-2022) 1.4.5 Japan Ion Exchange Membrane of All-Vanadium Redox Flow Battery Status and Prospect (2012-2022) 1.5 Global Ion Exchange Membrane of All-Vanadium Redox Flow Battery Market Size (2012-2022) Email: sales@qyresearch.com; Tel: 001-6262952442 0086-1082945717; www.qyresearch.com
2017 Market Research Report on Global Ion Exchange Membrane ofAll-Vanadium Redox Flow Battery Industry 1.5.1 Global Ion Exchange Membrane of All-Vanadium Redox Flow Battery Revenue (Million USD) Status and Outlook (2012-2022) 1.5.2 Global Ion Exchange Membrane of All-Vanadium Redox Flow Battery Capacity, Production (K Units) Status and Outlook (2012-2022) 2 Global Ion Exchange Membrane of All-Vanadium Redox Flow Battery Market Competition by Manufacturers 2.1 Global Ion Exchange Membrane of All-Vanadium Redox Flow Battery Capacity, Production and Share by Manufacturers (2012-2017) 2.1.1 Global Ion Exchange Membrane of All-Vanadium Redox Flow Battery Capacity (K Units) and Share (%) by Manufacturers (2012-2017) 2.1.2 Global Ion Exchange Membrane of All-Vanadium Redox Flow Battery Production (K Units) and Share (%) by Manufacturers (2012-2017) 2.2 Global Ion Exchange Membrane of All-Vanadium Redox Flow Battery Revenue (Million USD) and Share (%) by Manufacturers (2012-2017) 2.3 Global Ion Exchange Membrane of All-Vanadium Redox Flow Battery Average Price (USD/Unit) by Manufacturers (2012-2017) 2.4 Manufacturers Ion Exchange Membrane of All-Vanadium Redox Flow Battery Manufacturing Base Distribution, Sales Area, Product Types 2.5 Ion Exchange Membrane of All-Vanadium Redox Flow Battery Market Competitive Situation and Trends 2.5.1 Ion Exchange Membrane of All-Vanadium Redox Flow Battery Market Concentration Rate 2.5.2 Ion Exchange Membrane of All-Vanadium Redox Flow Battery Market Share (%) of Top 3 and Top 5 Manufacturers 2.5.3 Mergers & Acquisitions, Expansion 3 Global Ion Exchange Membrane of All-Vanadium Redox Flow Battery Production by Regions (2012-2017) 3.1 Global Ion Exchange Membrane ofAll-Vanadium Redox Flow Battery Capacity (K Units) and Market Share (%) by Regions (2012-2017) 3.2 Global Ion Exchange Membrane of All-Vanadium Redox Flow Battery Production (K Units) and Market Share (%) by Regions (2012-2017) 3.3 Global Ion Exchange Membrane of All-Vanadium Redox Flow Battery Revenue and Market Share (%) by Regions (2012-2017) 3.4 Global Ion Exchange Membrane of All-Vanadium Redox Flow Battery Capacity, Production (K Units), Revenue (Million USD), Price (USD/Unit) and Gross Margin (%) (2012-2017) 3.5 North America Ion Exchange Membrane of All-Vanadium Redox Flow Battery Production (2012-2017) 3.5.1 North America Ion Exchange Membrane of All-Vanadium Redox Flow Battery Production (K Units) and Growth Rate (%) (2012-2017) 3.5.2 North America Ion Exchange Membrane of All-Vanadium Redox Flow Battery Capacity, Production (K Units), Revenue (Million USD), Price (USD/Unit) and Gross Margin (%) (2012-2017) 3.6 Europe Ion Exchange Membrane of All-Vanadium Redox Flow Battery Production Email: sales@qyresearch.com; Tel: 001-6262952442 0086-1082945717; www.qyresearch.com
2017 Market Research Report on Global Ion Exchange Membrane ofAll-Vanadium Redox Flow Battery Industry (2012-2017) 3.6.1 Europe Ion Exchange Membrane of All-Vanadium Redox Flow Battery Production (K Units) and Growth Rate (%) (2012-2017) 3.6.2 Europe Ion Exchange Membrane of All-Vanadium Redox Flow Battery Capacity, Production (K Units), Revenue (Million USD), Price (USD/Unit) and Gross Margin (%) (2012-2017) 3.7 China Ion Exchange Membrane of All-Vanadium Redox Flow Battery Production (2012-2017) 3.7.1 China Ion Exchange Membrane of All-Vanadium Redox Flow Battery Production (K Units) and Growth Rate (%) (2012-2017) 3.7.2 China Ion Exchange Membrane of All-Vanadium Redox Flow Battery Capacity, Production (K Units), Revenue (Million USD), Price (USD/Unit) and Gross Margin (%) (2012-2017) 3.8 Japan Ion Exchange Membrane of All-Vanadium Redox Flow Battery Production (2012-2017) 3.8.1 Japan Ion Exchange Membrane of All-Vanadium Redox Flow Battery Production (K Units) and Growth Rate (%) (2012-2017) 3.8.2 Japan Ion Exchange Membrane of All-Vanadium Redox Flow Battery Capacity, Production (K Units), Revenue (Million USD), Price (USD/Unit) and Gross Margin (%) (2012-2017) 4 Global Ion Exchange Membrane of All-Vanadium Redox Flow Battery Consumption (K Units) by Regions (2012-2017) 4.1 Global Ion Exchange Membrane of All-Vanadium Redox Flow Battery Consumption (K Units) by Regions (2012-2017) 4.2 North America Ion Exchange Membrane of All-Vanadium Redox Flow Battery Consumption (K Units) (2012-2017) 4.3 Europe Ion Exchange Membrane of All-Vanadium Redox Flow Battery Consumption (K Units) (2012-2017) 4.4 China Ion Exchange Membrane of All-Vanadium Redox Flow Battery Consumption (K Units) (2012-2017) 4.5 Japan Ion Exchange Membrane of All-Vanadium Redox Flow Battery Consumption (K Units) (2012-2017) 4.6 Southeast Asia Ion Exchange Membrane of All-Vanadium Redox Flow Battery Consumption (K Units) (2012-2017) 4.7 India Ion Exchange Membrane of All-Vanadium Redox Flow Battery Consumption (K Units) (2012-2017) 4.8 South America Ion Exchange Membrane of All-Vanadium Redox Flow Battery Consumption (K Units) (2012-2017) 4.9 Middle East and Africa Ion Exchange Membrane of All-Vanadium Redox Flow Battery Consumption (K Units) (2012-2017) 5 Global Ion Exchange Membrane of All-Vanadium Redox Flow Battery Production, Revenue, Price Trend by Types 5.1 Global Ion Exchange Membrane of All-Vanadium Redox Flow Battery Production (K Units) and Market Share (%) by Types (2012-2017) Email: sales@qyresearch.com; Tel: 001-6262952442 0086-1082945717; www.qyresearch.com
2017 Market Research Report on Global Ion Exchange Membrane ofAll-Vanadium Redox Flow Battery Industry 5.2 Global Ion Exchange Membrane of All-Vanadium Redox Flow Battery Revenue (Million USD) and Market Share (%) by Types (2012-2017) 5.3 Global Ion Exchange Membrane of All-Vanadium Redox Flow Battery Price (USD/Unit) by Type (2012-2017) 5.4 Global Ion Exchange Membrane of All-Vanadium Redox Flow Battery Production Growth (%) by Type (2012-2017) 6 Global Ion Exchange Membrane of All-Vanadium Redox Flow Battery Market Analysis by Applications 6.1 Global Ion Exchange Membrane of All-Vanadium Redox Flow Battery Consumption (K Units) and Market Share (%) by Applications (2012-2017) 6.2 Global Ion Exchange Membrane of All-Vanadium Redox Flow Battery Consumption Growth Rate by Applications (2012-2017) 7 Global Ion Exchange Membrane of All-Vanadium Redox Flow Battery Manufacturers Profiles/Analysis 7.1 Chemours (DuPont) 7.1.1 Company Basic Information, Manufacturing Base, Sales Area and Its Competitors 7.1.2 Ion Exchange Membrane of All-Vanadium Redox Flow Battery Product Category, Application and Specification 7.1.2.1 Product A 7.1.2.2 Product B 7.1.3 Chemours (DuPont) Ion Exchange Membrane of All-Vanadium Redox Flow Battery Capacity, Production (K Units), Revenue (Million USD), Price (USD/Unit) and Gross Margin (%) (2012-2017) 7.1.4 Main Business/Business Overview 7.2 FuMa-Tech 7.2.1 Company Basic Information, Manufacturing Base, Sales Area and Its Competitors 7.2.2 Ion Exchange Membrane of All-Vanadium Redox Flow Battery Product Category, Application and Specification 7.2.2.1 Product A 7.2.2.2 Product B 7.2.3 FuMa-Tech Ion Exchange Membrane of All-Vanadium Redox Flow Battery Capacity, Production (K Units), Revenue (Million USD), Price (USD/Unit) and Gross Margin (%) (2012-2017) 7.2.4 Main Business/Business Overview 7.3 Golden Energy Fuel Cell 7.3.1 Company Basic Information, Manufacturing Base, Sales Area and Its Competitors 7.3.2 Ion Exchange Membrane of All-Vanadium Redox Flow Battery Product Category, Application and Specification 7.3.2.1 Product A 7.3.2.2 Product B 7.3.3 Golden Energy Fuel Cell Ion Exchange Membrane of All-Vanadium Redox Flow Battery Capacity, Production (K Units), Revenue (Million USD), Price (USD/Unit) and Gross Margin (%) (2012-2017) 7.3.4 Main Business/Business Overview Email: sales@qyresearch.com; Tel: 001-6262952442 0086-1082945717; www.qyresearch.com
2017 Market Research Report on Global Ion Exchange Membrane ofAll-Vanadium Redox Flow Battery Industry 7.4 Dalian Institute of Chemical Physics 7.4.1 Company Basic Information, Manufacturing Base, Sales Area and Its Competitors 7.4.2 Ion Exchange Membrane of All-Vanadium Redox Flow Battery Product Category, Application and Specification 7.4.2.1 Product A 7.4.2.2 Product A 7.4.3 Dalian Institute of Chemical Physics Ion Exchange Membrane of All-Vanadium Redox Flow Battery Capacity, Production (K Units), Revenue (Million USD), Price (USD/Unit) and Gross Margin (%) (2012-2017) 7.4.4 Main Business/Business Overview 8 Ion Exchange Membrane of All-Vanadium Redox Flow Battery Manufacturing Cost Analysis 8.1 Ion Exchange Membrane of All-Vanadium Redox Flow Battery Key Raw Materials Analysis 8.1.1 Key Raw Materials 8.1.2 Price Trend of Key Raw Materials 8.1.3 Key Suppliers of Raw Materials 8.1.4 Market Concentration Rate of Raw Materials 8.2 Proportion of Manufacturing Cost Structure 8.2.1 Raw Materials 8.2.2 Labor Cost 8.2.3 Manufacturing Expenses 8.3 Manufacturing Process Analysis of Ion Exchange Membrane of All-Vanadium Redox Flow Battery 9 Industrial Chain, Sourcing Strategy and Downstream Buyers 9.1 Ion Exchange Membrane ofAll-Vanadium Redox Flow Battery Industrial Chain Analysis 9.2 Upstream Raw Materials Sourcing 9.3 Raw Materials Sources of Ion Exchange Membrane of All-Vanadium Redox Flow Battery Major Manufacturers in 2016 9.4 Downstream Buyers 10 Marketing StrategyAnalysis, Distributors/Traders 10.1 Marketing Channel 10.1.1 Direct Marketing 10.1.2 Indirect Marketing 10.1.3 Marketing Channel Development Trend 10.2 Market Positioning 10.2.1 Pricing Strategy 10.2.2 Brand Strategy 10.2.3 Target Client 10.3 Distributors/Traders List 11 Market Effect FactorsAnalysis 11.1 Technology Progress/Risk 11.1.1 Substitutes Threat 11.1.2 Technology Progress in Related Industry Email: sales@qyresearch.com; Tel: 001-6262952442 0086-1082945717; www.qyresearch.com
2017 Market Research Report on Global Ion Exchange Membrane ofAll-Vanadium Redox Flow Battery Industry 11.2 Consumer Needs/Customer Preference Change 11.3 Economic/Political Environmental Change 12 Global Ion Exchange Membrane of All-Vanadium Redox Flow Battery Market Forecast (2017-2022) 12.1 Global Ion Exchange Membrane of All-Vanadium Redox Flow Battery Capacity, Production, Revenue Forecast (2017-2022) 12.1.1 Global Ion Exchange Membrane of All-Vanadium Redox Flow Battery Capacity, Production (K Units) and Growth Rate (%) Forecast (2017-2022) 12.1.2 Global Ion Exchange Membrane of All-Vanadium Redox Flow Battery Revenue (Million USD) and Growth Rate (%) Forecast (2017-2022) 12.1.3 Global Ion Exchange Membrane of All-Vanadium Redox Flow Battery Price and Trend Forecast (2017-2022) 12.2 Global Ion Exchange Membrane of All-Vanadium Redox Flow Battery Production (K Units) Forecast by Regions (2017-2022) 12.2.1 North America Ion Exchange Membrane of All-Vanadium Redox Flow Battery Production (K Units) and Revenue (Million USD) Forecast (2017-2022) 12.2.2 Europe Ion Exchange Membrane of All-Vanadium Redox Flow Battery Production (K Units), Revenue (Million USD) Forecast (2017-2022) 12.2.3 China Ion Exchange Membrane of All-Vanadium Redox Flow Battery Production (K Units), Revenue (Million USD) Forecast (2017-2022) 12.2.4 Japan Ion Exchange Membrane of All-Vanadium Redox Flow Battery Production (K Units), Revenue (Million USD) Forecast (2017-2022) 12.3 Global Ion Exchange Membrane of All-Vanadium Redox Flow Battery Consumption (K Units) Forecast by Regions (2017-2022) 12.3.1 North America Ion Exchange Membrane of All-Vanadium Redox Flow Battery Consumption (K Units) Forecast (2017-2022) 12.3.2 Europe Ion Exchange Membrane of All-Vanadium Redox Flow Battery Consumption (K Units) Forecast (2017-2022) 12.3.3 China Ion Exchange Membrane of All-Vanadium Redox Flow Battery Consumption (K Units) Forecast (2017-2022) 12.3.4 Japan Ion Exchange Membrane of All-Vanadium Redox Flow Battery Consumption (K Units) Forecast (2017-2022) 12.3.5 Southeast Asia Ion Exchange Membrane of All-Vanadium Redox Flow Battery Consumption (K Units) Forecast (2017-2022) 12.3.6 India Ion Exchange Membrane of All-Vanadium Redox Flow Battery Consumption (K Units) Forecast (2017-2022) 12.3.7 South America Ion Exchange Membrane of All-Vanadium Redox Flow Battery Consumption (K Units) Forecast (2017-2022) 12.3.8 Middle East Ion Exchange Membrane of All-Vanadium Redox Flow Battery Consumption (K Units) Forecast (2017-2022) 12.4 Global Ion Exchange Membrane of All-Vanadium Redox Flow Battery Production, Revenue and Price Forecast by Type (2017-2022) 12.5 Global Ion Exchange Membrane of All-Vanadium Redox Flow Battery Consumption Forecast byApplication (2017-2022) Email: sales@qyresearch.com; Tel: 001-6262952442 0086-1082945717; www.qyresearch.com
2017 Market Research Report on Global Ion Exchange Membrane ofAll-Vanadium Redox Flow Battery Industry 13 Research Findings and Conclusion List of Tables and Figures Table Research Programs/Design for This Report Figure Bottom-up and Top-down Approaches for This Report Figure Data Triangulation Table Key Data Information from Secondary Sources Table Key Data Information from Primary Sources Figure Product Picture of Ion Exchange Membrane ofAll-Vanadium Redox Flow Battery Table Global Ion Exchange Membrane of All-Vanadium Redox Flow Battery Production (K Units) and Growth Rate (%) Comparison by Types (Product Category) (2012-2022) Figure Global Ion Exchange Membrane of All-Vanadium Redox Flow Battery Production Market Share (%) by Types (Product Category) in 2016 Figure Product Picture of Full-fluorinion Ion Exchange Membrane Table Major Manufacturers of Full-fluorinion Ion Exchange Membrane Figure Product Picture of Non-fluorinion Ion Exchange Membrane Table Major Manufacturers of Non-fluorinion Ion Exchange Membrane TableApplications of Ion Exchange Membrane ofAll-Vanadium Redox Flow Battery Figure Global Ion Exchange Membrane of All-Vanadium Redox Flow Battery Consumption (K Units) Market Share (%) by Applications in 2016 Figure Renewable Power Supply Examples Figure Industrial Grid(Excluding Renewable Power) Adjustment and Management Examples Figure Others Examples Figure Global Ion Exchange Membrane of All-Vanadium Redox Flow Battery Market Size (Million USD) Comparison and Growth Rate (%) by Regions (2012-2022) Figure North America Ion Exchange Membrane of All-Vanadium Redox Flow Battery Revenue (Million USD) and Growth Rate (2012-2022) Figure China Ion Exchange Membrane of All-Vanadium Redox Flow Battery Revenue (Million USD) and Growth Rate (2012-2022) Figure Europe Ion Exchange Membrane of All-Vanadium Redox Flow Battery Revenue (Million USD) and Growth Rate (2012-2022) Figure Japan Ion Exchange Membrane of All-Vanadium Redox Flow Battery Revenue (Million USD) and Growth Rate (2012-2022) Figure Global Ion Exchange Membrane of All-Vanadium Redox Flow Battery Revenue (Million USD) Status and Outlook (2012-2022) Figure Global Ion Exchange Membrane of All-Vanadium Redox Flow Battery Capacity, Production (K Units) Status and Outlook (2012-2022) Figure Global Ion Exchange Membrane of All-Vanadium Redox Flow Battery Major Players Product Capacity (K Units) 2012-2017 Table Global Ion Exchange Membrane of All-Vanadium Redox Flow Battery Capacity (K Units) of Key Manufacturers (2012-2017) Table Global Ion Exchange Membrane of All-Vanadium Redox Flow Battery Capacity Market Share (%) of Key Manufacturers (2012-2017) Email: sales@qyresearch.com; Tel: 001-6262952442 0086-1082945717; www.qyresearch.com
2017 Market Research Report on Global Ion Exchange Membrane ofAll-Vanadium Redox Flow Battery Industry Figure Global Ion Exchange Membrane of All-Vanadium Redox Flow Battery Capacity Market Share (%) of Key Manufacturers in 2016 Figure Global Ion Exchange Membrane of All-Vanadium Redox Flow Battery Capacity Market Share (%) of Key Manufacturers in 2017 Figure Global Ion Exchange Membrane of All-Vanadium Redox Flow Battery Major Players Product Production (K Units) 2012-2017 Table Global Ion Exchange Membrane of All-Vanadium Redox Flow Battery Production (K Units) of Key Manufacturers (2012-2017) Table Global Ion Exchange Membrane of All-Vanadium Redox Flow Battery Production Share (%) by Manufacturers (2012-2017) Figure 2016 Ion Exchange Membrane of All-Vanadium Redox Flow Battery Production Share (%) by Manufacturers Figure 2016 Ion Exchange Membrane of All-Vanadium Redox Flow Battery Production Share (%) by Manufacturers Figure Global Ion Exchange Membrane of All-Vanadium Redox Flow Battery Major Players Product Revenue (Million USD) 2012-2017 Table Global Ion Exchange Membrane of All-Vanadium Redox Flow Battery Revenue (Million USD) by Manufacturers (2012-2017) Table Global Ion Exchange Membrane of All-Vanadium Redox Flow Battery Revenue Share (%) by Manufacturers (2012-2017) Table 2016 Global Ion Exchange Membrane of All-Vanadium Redox Flow Battery Revenue Share (%) by Manufacturers Table 2016 Global Ion Exchange Membrane of All-Vanadium Redox Flow Battery Revenue Share (%) by Manufacturers Table Global Market Ion Exchange Membrane of All-Vanadium Redox Flow Battery Average Price (USD/Unit) of Key Manufacturers (2012-2017) Figure Global Market Ion Exchange Membrane of All-Vanadium Redox Flow Battery Average Price (USD/Unit) of Key Manufacturers in 2016 Table Manufacturers Ion Exchange Membrane of All-Vanadium Redox Flow Battery Manufacturing Base Distribution and SalesArea Table Manufacturers Ion Exchange Membrane of All-Vanadium Redox Flow Battery Product Category Figure Ion Exchange Membrane of All-Vanadium Redox Flow Battery Market Share (%) of Top 3 Manufacturers Figure Ion Exchange Membrane of All-Vanadium Redox Flow Battery Market Share (%) of Top 5 Manufacturers Table Global Ion Exchange Membrane of All-Vanadium Redox Flow Battery Capacity (K Units) by Regions (2012-2017) Figure Global Ion Exchange Membrane of All-Vanadium Redox Flow Battery Capacity Market Share (%) by Regions (2012-2017) Figure Global Ion Exchange Membrane of All-Vanadium Redox Flow Battery Capacity Market Share (%) by Regions (2012-2017) Figure 2016 Global Ion Exchange Membrane of All-Vanadium Redox Flow Battery Capacity Market Share (%) by Regions Email: sales@qyresearch.com; Tel: 001-6262952442 0086-1082945717; www.qyresearch.com
2017 Market Research Report on Global Ion Exchange Membrane ofAll-Vanadium Redox Flow Battery Industry Table Global Ion Exchange Membrane of All-Vanadium Redox Flow Battery Production (K Units) by Regions (2012-2017) Figure Global Ion Exchange Membrane of All-Vanadium Redox Flow Battery Production Market Share (%) by Regions (2012-2017) Figure Global Ion Exchange Membrane of All-Vanadium Redox Flow Battery Production Market Share (%) by Regions (2012-2017) Figure 2016 Global Ion Exchange Membrane of All-Vanadium Redox Flow Battery Production Market Share (%) by Regions Table Global Ion Exchange Membrane of All-Vanadium Redox Flow Battery Revenue (Million USD) by Regions (2012-2017) Table Global Ion Exchange Membrane of All-Vanadium Redox Flow Battery Revenue Market Share (%) by Regions (2012-2017) Figure Global Ion Exchange Membrane of All-Vanadium Redox Flow Battery Revenue Market Share (%) by Regions (2012-2017) Figure 2016 Global Ion Exchange Membrane of All-Vanadium Redox Flow Battery Revenue Market Share (%) by Regions Figure Global Ion Exchange Membrane of All-Vanadium Redox Flow Battery Capacity, Production (K Units) and Growth Rate (2012-2017) Table Global Ion Exchange Membrane of All-Vanadium Redox Flow Battery Capacity, Production (K Units), Revenue (Million USD), Price (USD/Unit) and Gross Margin (%) (2012-2017) Figure North America Ion Exchange Membrane of All-Vanadium Redox Flow Battery Production (K Units) and Growth Rate (%) (2012-2017) Table North America Ion Exchange Membrane of All-Vanadium Redox Flow Battery Capacity, Production (K Units), Revenue (Million USD), Price (USD/Unit) and Gross Margin (%) (2012-2017) Figure Europe Ion Exchange Membrane of All-Vanadium Redox Flow Battery Production (K Units) and Growth Rate (%) (2012-2017) Table Europe Ion Exchange Membrane of All-Vanadium Redox Flow Battery Capacity, Production (K Units), Revenue (Million USD), Price (USD/Unit) and Gross Margin (%) (2012-2017) Figure China Ion Exchange Membrane of All-Vanadium Redox Flow Battery Production (K Units) and Growth Rate (%) (2012-2017) Table China Ion Exchange Membrane of All-Vanadium Redox Flow Battery Capacity, Production (K Units), Revenue (Million USD), Price (USD/Unit) and Gross Margin (%) (2012-2017) Figure Japan Ion Exchange Membrane of All-Vanadium Redox Flow Battery Production (K Units) and Growth Rate (%) (2012-2017) Table Japan Ion Exchange Membrane of All-Vanadium Redox Flow Battery Capacity, Production (K Units), Revenue (Million USD), Price (USD/Unit) and Gross Margin (%) (2012-2017) Table Global Ion Exchange Membrane of All-Vanadium Redox Flow Battery Consumption (K Units) Market by Regions (2012-2017) Table Global Ion Exchange Membrane of All-Vanadium Redox Flow Battery Consumption Email: sales@qyresearch.com; Tel: 001-6262952442 0086-1082945717; www.qyresearch.com
2017 Market Research Report on Global Ion Exchange Membrane ofAll-Vanadium Redox Flow Battery Industry Market Share (%) by Regions (2012-2017) Figure Global Ion Exchange Membrane of All-Vanadium Redox Flow Battery Consumption Market Share (%) by Regions (2012-2017) Figure 2016 Global Ion Exchange Membrane of All-Vanadium Redox Flow Battery Consumption Market Share (%) by Regions Figure North America Ion Exchange Membrane of All-Vanadium Redox Flow Battery Consumption and Growth Rate (%) (2012-2017) Figure Europe Ion Exchange Membrane of All-Vanadium Redox Flow Battery Consumption and Growth Rate (%) (2012-2017) Figure China Ion Exchange Membrane of All-Vanadium Redox Flow Battery Consumption and Growth Rate (%) (2012-2017) Figure Japan Ion Exchange Membrane of All-Vanadium Redox Flow Battery Consumption and Growth Rate (%) (2012-2017) Figure Southeast Asia Ion Exchange Membrane of All-Vanadium Redox Flow Battery Consumption and Growth Rate (%) (2012-2017) Figure India Ion Exchange Membrane of All-Vanadium Redox Flow Battery Consumption and Growth Rate (%) (2012-2017) Figure South America Ion Exchange Membrane of All-Vanadium Redox Flow Battery Consumption and Growth Rate (%) (2012-2017) Figure Middle East and Africa Ion Exchange Membrane of All-Vanadium Redox Flow Battery Consumption and Growth Rate (%) (2012-2017) Table Global Ion Exchange Membrane of All-Vanadium Redox Flow Battery Production (K Units) by Types (2012-2017) Table Global Ion Exchange Membrane of All-Vanadium Redox Flow Battery Production Share (%) by Types (2012-2017) Figure Production Market Share (%) of Ion Exchange Membrane of All-Vanadium Redox Flow Battery by Types (2012-2017) Figure 2016 Production Market Share (%) of Ion Exchange Membrane of All-Vanadium Redox Flow Battery by Types Table Global Ion Exchange Membrane of All-Vanadium Redox Flow Battery Revenue (Million USD) by Types (2012-2017) Table Global Ion Exchange Membrane of All-Vanadium Redox Flow Battery Revenue Share (%) by Types (2012-2017) Figure Revenue Share (%) of Ion Exchange Membrane of All-Vanadium Redox Flow Battery by Types (2012-2017) Figure 2016 Revenue Market Share (%) of Ion Exchange Membrane of All-Vanadium Redox Flow Battery by Types Table Global Ion Exchange Membrane of All-Vanadium Redox Flow Battery Price (USD/Unit) by Types (2012-2017) Figure Global Ion Exchange Membrane of All-Vanadium Redox Flow Battery Production Growth (%) by Type (2012-2017) Table Global Ion Exchange Membrane of All-Vanadium Redox Flow Battery Consumption (K Units) byApplications (2012-2017) Table Global Ion Exchange Membrane of All-Vanadium Redox Flow Battery Consumption Email: sales@qyresearch.com; Tel: 001-6262952442 0086-1082945717; www.qyresearch.com
2017 Market Research Report on Global Ion Exchange Membrane ofAll-Vanadium Redox Flow Battery Industry Market Share (%) by Applications (2012-2017) Figure Global Ion Exchange Membrane of All-Vanadium Redox Flow Battery Consumption Market Share (%) by Applications (2012-2017) Figure Global Ion Exchange Membrane of All-Vanadium Redox Flow Battery Consumption Market Share (%) by Applications in 2016 Table Global Ion Exchange Membrane of All-Vanadium Redox Flow Battery Consumption Growth Rate by Applications (2012-2017) Figure Global Ion Exchange Membrane of All-Vanadium Redox Flow Battery Consumption Growth Rate by Applications (2012-2017) Table Chemours (DuPont) Basic Information, Manufacturing Base, Sales Area and Its Competitors Table Chemours (DuPont) Ion Exchange Membrane of All-Vanadium Redox Flow Battery Capacity, Production (K Units), Revenue (Million USD), Price (USD/Unit) and Gross Margin (%) (2012-2017) Figure Chemours (DuPont) Ion Exchange Membrane of All-Vanadium Redox Flow Battery Production Growth Rate (%) (2012-2017) Figure Chemours (DuPont) Ion Exchange Membrane of All-Vanadium Redox Flow Battery Production Market Share (%) (2012-2017) Figure Chemours (DuPont) Ion Exchange Membrane of All-Vanadium Redox Flow Battery Revenue Market Share (%) (2012-2017) Table FuMa-Tech Basic Information, Manufacturing Base, Sales Area and Its Competitors Table FuMa-Tech Ion Exchange Membrane of All-Vanadium Redox Flow Battery Capacity, Production (K Units), Revenue (Million USD), Price (USD/Unit) and Gross Margin (%) (2012-2017) Figure FuMa-Tech Ion Exchange Membrane of All-Vanadium Redox Flow Battery Production Growth Rate (%) (2012-2017) Figure FuMa-Tech Ion Exchange Membrane of All-Vanadium Redox Flow Battery Production Market Share (%) (2012-2017) Figure FuMa-Tech Ion Exchange Membrane of All-Vanadium Redox Flow Battery Revenue Market Share (%) (2012-2017) Table Golden Energy Fuel Cell Basic Information, Manufacturing Base, Sales Area and Its Competitors Table Golden Energy Fuel Cell Ion Exchange Membrane of All-Vanadium Redox Flow Battery Capacity, Production (K Units), Revenue (Million USD), Price (USD/Unit) and Gross Margin (%) (2012-2017) Figure Golden Energy Fuel Cell Ion Exchange Membrane of All-Vanadium Redox Flow Battery Production Growth Rate (%) (2012-2017) Figure Golden Energy Fuel Cell Ion Exchange Membrane of All-Vanadium Redox Flow Battery Production Market Share (%) (2012-2017) Figure Golden Energy Fuel Cell Ion Exchange Membrane of All-Vanadium Redox Flow Battery Revenue Market Share (%) (2012-2017) Table Dalian Institute of Chemical Physics Basic Information, Manufacturing Base, Sales Area and Its Competitors Table Dalian Institute of Chemical Physics Ion Exchange Membrane of All-Vanadium Redox Email: sales@qyresearch.com; Tel: 001-6262952442 0086-1082945717; www.qyresearch.com
2017 Market Research Report on Global Ion Exchange Membrane ofAll-Vanadium Redox Flow Battery Industry Flow Battery Capacity, Production (K Units), Revenue (Million USD), Price (USD/Unit) and Gross Margin (%) (2012-2017) Figure Dalian Institute of Chemical Physics Ion Exchange Membrane of All-Vanadium Redox Flow Battery Production Growth Rate (%) (2012-2017) Figure Dalian Institute of Chemical Physics Ion Exchange Membrane of All-Vanadium Redox Flow Battery Production Market Share (%) (2012-2017) Figure Dalian Institute of Chemical Physics Ion Exchange Membrane of All-Vanadium Redox Flow Battery Revenue Market Share (%) (2012-2017) Table Production Base and Market Concentration Rate of Raw Material Figure Price Trend of Key Raw Materials Table Key Suppliers of Raw Materials Figure Manufacturing Cost Structure of Ion Exchange Membrane of All-Vanadium Redox Flow Battery Figure Manufacturing Process Analysis of Ion Exchange Membrane of All-Vanadium Redox Flow Battery Figure Ion Exchange Membrane of All-Vanadium Redox Flow Battery Industrial Chain Analysis Table Raw Materials Sources of Ion Exchange Membrane of All-Vanadium Redox Flow Battery Major Manufacturers in 2016 Table Major Buyers of Ion Exchange Membrane ofAll-Vanadium Redox Flow Battery Table Distributors/Traders List Figure Global Ion Exchange Membrane of All-Vanadium Redox Flow Battery Capacity, Production (K Units) and Growth Rate (%) Forecast (2017-2022) Figure Global Ion Exchange Membrane of All-Vanadium Redox Flow Battery Revenue (Million USD) and Growth Rate (%) Forecast (2017-2022) Figure Global Ion Exchange Membrane of All-Vanadium Redox Flow Battery Price and Trend Forecast (2017-2022) Table Global Ion Exchange Membrane of All-Vanadium Redox Flow Battery Production (K Units) Forecast by Regions (2017-2022) Figure Global Ion Exchange Membrane of All-Vanadium Redox Flow Battery Production Market Share (%) Forecast by Regions (2017-2022) Figure North America Ion Exchange Membrane of All-Vanadium Redox Flow Battery Production (K Units) and Growth Rate (%) Forecast (2017-2022) Figure North America Ion Exchange Membrane of All-Vanadium Redox Flow Battery Revenue (Million USD) and Growth Rate (%) Forecast (2017-2022) Figure Europe Ion Exchange Membrane of All-Vanadium Redox Flow Battery Production (K Units) and Growth Rate Forecast (2017-2022) Figure Europe Ion Exchange Membrane of All-Vanadium Redox Flow Battery Revenue (Million USD) and Growth Rate (%) Forecast (2017-2022) Figure China Ion Exchange Membrane of All-Vanadium Redox Flow Battery Production (K Units) and Growth Rate (%) Forecast (2017-2022) Figure China Ion Exchange Membrane of All-Vanadium Redox Flow Battery Revenue (Million USD) and Growth Rate (%) Forecast (2017-2022) Figure Japan Ion Exchange Membrane of All-Vanadium Redox Flow Battery Production (K Email: sales@qyresearch.com; Tel: 001-6262952442 0086-1082945717; www.qyresearch.com
2017 Market Research Report on Global Ion Exchange Membrane ofAll-Vanadium Redox Flow Battery Industry Units) and Growth Rate (%) Forecast (2017-2022) Figure Japan Ion Exchange Membrane of All-Vanadium Redox Flow Battery Revenue (Million USD) and Growth Rate (%) Forecast (2017-2022) Table Global Ion Exchange Membrane of All-Vanadium Redox Flow Battery Consumption (K Units) Forecast by Regions (2017-2022) Figure Global Ion Exchange Membrane of All-Vanadium Redox Flow Battery Consumption Market Share (%) Forecast by Regions (2017-2022) Figure North America Ion Exchange Membrane of All-Vanadium Redox Flow Battery Consumption (K Units) and Growth Rate (%) Forecast (2017-2022) Figure Europe Ion Exchange Membrane of All-Vanadium Redox Flow Battery Consumption (K Units) and Growth Rate (%) Forecast (2017-2022) Figure China Ion Exchange Membrane of All-Vanadium Redox Flow Battery Consumption (K Units) and Growth Rate (%) Forecast (2017-2022) Figure Japan Ion Exchange Membrane of All-Vanadium Redox Flow Battery Consumption (K Units) and Growth Rate (%) Forecast (2017-2022) Figure Southeast Asia Ion Exchange Membrane of All-Vanadium Redox Flow Battery Consumption (K Units) and Growth Rate (%) Forecast (2017-2022) Figure India Ion Exchange Membrane of All-Vanadium Redox Flow Battery Consumption (K Units) and Growth Rate (%) Forecast (2017-2022) Figure South America Ion Exchange Membrane of All-Vanadium Redox Flow Battery Consumption (K Units) and Growth Rate (%) Forecast (2017-2022) Figure Middle East Ion Exchange Membrane of All-Vanadium Redox Flow Battery Consumption (K Units) and Growth Rate (%) Forecast (2017-2022) Table Global Ion Exchange Membrane of All-Vanadium Redox Flow Battery Production (K Units) Forecast by Type (2017-2022) Figure Global Ion Exchange Membrane of All-Vanadium Redox Flow Battery Production Forecast by Type (2017-2022) Table Global Ion Exchange Membrane of All-Vanadium Redox Flow Battery Revenue (Million USD) Forecast by Type (2017-2022) Figure Global Ion Exchange Membrane of All-Vanadium Redox Flow Battery Revenue Market Share (%) Forecast by Type (2017-2022) Table Global Ion Exchange Membrane of All-Vanadium Redox Flow Battery Price (USD/Unit) Forecast by Type (2017-2022) Table Global Ion Exchange Membrane of All-Vanadium Redox Flow Battery Consumption (K Units) Forecast byApplication (2017-2022) Figure Global Ion Exchange Membrane of All-Vanadium Redox Flow Battery Consumption Forecast byApplication (2017-2022) Email: sales@qyresearch.com; Tel: 001-6262952442 0086-1082945717; www.qyresearch.com
2017 Market Research Report on Global Ion Exchange Membrane ofAll-Vanadium Redox Flow Battery Industry 1 Ion Exchange Membrane of All-Vanadium Redox Flow Battery Market Overview 1.1 Product Overview and Scope of Ion Exchange Membrane of All-Vanadium Redox Flow Battery The vanadium redox battery (VRB) (or Vanadium flow battery) is a type of rechargeable flow battery that employs vanadium ions in different oxidation states to store chemical potential energy. The vanadium redox battery exploits the ability of vanadium to exist in solution in four different oxidation states, and uses this property to make a battery that has just one electroactive element instead of two. As the schematic shown in Fig, a vanadium redox-flow battery has two chambers, a positive chamber and a negative chamber, separated by an ion-exchange membrane. These two chambers are circulated with electrolytes containing active species of vanadium in different valence states, VO2+/VO2+ in the positive electrolyte and V2+/V3+ in the negative electrolyte. During discharge process, VO2+ is reduced to VO2+ at the positive electrode and V2+ is oxidized to V3+ at the negative electrode, as shown in Equation(1) and (2). The reactions proceed in the opposite direction during charge process. The active species are normally dissolved in a strong acid, and the protons transport across the ion-exchange membrane to balance the charge. In our report, we cover the ion exchange membrane of all-vanadium redox flow battery. Commercial ion-exchange membranes should have high proton conductivity, good selectivity, and especially low cost. At present, ion-exchange membrane prices are still too high. This affects the installed capacity of vanadium redox flow battery. Email: sales@qyresearch.com; Tel: 001-6262952442 0086-1082945717; www.qyresearch.com
2017 Market Research Report on Global Ion Exchange Membrane ofAll-Vanadium Redox Flow Battery Industry Figure Product Picture of Ion Exchange Membrane of All-Vanadium Redox Flow Battery Source: Secondary Sources and QYR Chemical & Material Research Center, May 2017 1.2 Ion Exchange Membrane of All-Vanadium Redox Flow Battery Segment by Types (Product Category) 1.2.1 Global Ion Exchange Membrane of All-Vanadium Redox Flow Battery Production (K Units) and Growth Rate (%) Comparison by Types (Product Category) (2012-2022) Table Global Ion Exchange Membrane of All-Vanadium Redox Flow Battery Production (K Units) and Growth Rate (%) Comparison by Types (Product Category) (2012-2022) Market Segment by Type 201 6 XX 201 7 XX 201 8 XX 201 9 XX 202 0 XX 202 1 XX 202 2 XX Full-fluorinion Membrane -Change (%) Non-fluorinion Membrane -Change (%) Total Ion Exchange xx% XX xx% XX xx% XX xx% XX xx% XX xx% XX xx% XX Ion Exchange xx% XX xx% XX xx% XX xx% XX xx% XX xx% XX xx% XX Email: sales@qyresearch.com; Tel: 001-6262952442 0086-1082945717; www.qyresearch.com
2017 Market Research Report on Global Ion Exchange Membrane ofAll-Vanadium Redox Flow Battery Industry -Change (%) Source: Experts Interview, Secondary Sources and QYR Chemical & Material Research Center, May 2017 xx% xx% xx% xx% xx% xx% xx% 1.2.2 Global Ion Exchange Membrane of All-Vanadium Redox Flow Battery Production Market Share (%) by Types (Product Category) in 2016 Figure Global Ion Exchange Membrane of All-Vanadium Redox Flow Battery Production Market Share (%) by Types (Product Category) in 2016 Source: Experts Interview, Secondary Sources and QYR Chemical & Material Research Center, May 2017 1.2.3 Full-fluorinion Ion Exchange Membrane In 2016, the Full-fluorinion Ion Exchange Membrane production was XX and the market share was XX%, and it will be XX and XX% in 2022, with a Growth Rate XX% from 2016 to 2022. Figure Product Picture of Full-fluorinion Ion Exchange Membrane Source: Secondary Sources and QYR Chemical & Material Research Center, May 2017 Email: sales@qyresearch.com; Tel: 001-6262952442 0086-1082945717; www.qyresearch.com
2017 Market Research Report on Global Ion Exchange Membrane ofAll-Vanadium Redox Flow Battery Industry Table Major Manufacturers of Full-fluorinion Ion Exchange Membrane Manufacturers Location of Manufacturing Bases/Factories 1 2 3 … Source: Above companies; Secondary Sources, Press Releases, Expert Interviews and QYR Chemical & Material Research Center 1.2.4 Non-fluorinion Ion Exchange Membrane In 2016, the Non-fluorinion Ion Exchange Membrane production was XX and the market share was XX%, and it will be XX and XX% in 2022, with a Growth Rate XX% from 2016 to 2022. Figure Product Picture of Non-fluorinion Ion Exchange Membrane Source: Secondary Sources and QYR Chemical & Material Research Center, May 2017 Table Major Manufacturers of Non-fluorinion Ion Exchange Membrane Manufacturers Location of Manufacturing Bases/Factories 1 2 3 … Source: Above companies; Secondary Sources, Press Releases, Expert Interviews and QYR Chemical & Material Research Center Email: sales@qyresearch.com; Tel: 001-6262952442 0086-1082945717; www.qyresearch.com
2017 Market Research Report on Global Ion Exchange Membrane ofAll-Vanadium Redox Flow Battery Industry 1.3 Global Ion Exchange Membrane of All-Vanadium Redox Flow Battery Segment byApplications 1.3.1 Global Ion Exchange Membrane of All-Vanadium Redox Flow Battery Consumption (K Units) Comparison by Applications (2012-2022) Table Applications of Ion Exchange Membrane of All-Vanadium Redox Flow Battery Applications Renewable Power Supply Content Photovoltaic industry Wind power industry Electric bill management Frequency regulation Grid regulation of electricity peak Others Offline power supply Emergency power supply Communications and electronics industry UPS industry Others Industrial Power)Adjustment and Management Grid(Excluding Renewable Others Source: Experts Interview, Secondary Sources and QYR Chemical & Material Research Center, May 2017 Email: sales@qyresearch.com; Tel: 001-6262952442 0086-1082945717; www.qyresearch.com
2017 Market Research Report on Global Ion Exchange Membrane ofAll-Vanadium Redox Flow Battery Industry Figure Global Ion Exchange Membrane of All-Vanadium Redox Flow Battery Consumption (K Units) Market Share (%) byApplications in 2016 Source: Experts Interview, Secondary Sources and QYR Chemical & Material Research Center, May 2017 1.3.2 Renewable Power Supply Renewable Power Supply is a major application of Ion Exchange Membrane of All-Vanadium Redox Flow Battery, In 2016, the Ion Exchange Membrane of All-Vanadium Redox Flow Battery consumption (sales) in Renewable Power Supply was XX, and it will reach XXX in 2022; while the sales market share in Renewable Power Supply was XX% in 2016 and will be XXX% in 2022. Figure Renewable Power Supply Examples Source: Secondary Sources and QYR Chemical & Material Research Center, May 2017 1.3.3 Industrial Grid(Excluding Renewable Power) Adjustment and Management In 2016, the Ion Exchange Membrane of All-Vanadium Redox Flow Battery consumption (sales) in Industrial Grid(Excluding Renewable Power) Adjustment and Management was XX, and it will reach XXX in 2022; while the sales market share in Industrial Grid(Excluding Renewable Power) Adjustment and Management was XX% in 2016 and will be XXX% in 2022. Email: sales@qyresearch.com; Tel: 001-6262952442 0086-1082945717; www.qyresearch.com
2017 Market Research Report on Global Ion Exchange Membrane ofAll-Vanadium Redox Flow Battery Industry Figure Industrial Grid(Excluding Renewable Power) Adjustment and Management Examples Source: Secondary Sources and QYR Chemical & Material Research Center, May 2017 1.3.4 Others In 2016, the Ion Exchange Membrane of All-Vanadium Redox Flow Battery consumption (sales) in Others was XX, and it will reach XXX in 2022; while the sales market share in Others was XX% in 2016 and will be XXX% in 2022. Figure Others Examples Source: Secondary Sources and QYR Chemical & Material Research Center, May 2017 Email: sales@qyresearch.com; Tel: 001-6262952442 0086-1082945717; www.qyresearch.com
2017 Market Research Report on Global Ion Exchange Membrane ofAll-Vanadium Redox Flow Battery Industry 1.4 Global Ion Exchange Membrane of All-Vanadium Redox Flow Battery Market by Regions (2012-2022) 1.4.1 Global Ion Exchange Membrane of All-Vanadium Redox Flow Battery Market Size and Growth Rate (%) Comparison by Regions (2012-2022) Figure Global Ion Exchange Membrane of All-Vanadium Redox Flow Battery Market Size (Million USD) Comparison and Growth Rate (%) by Regions (2012-2022) Source: Experts Interview, Secondary Sources and QYR Chemical & Material Research Center, May 2017 Table Ion Exchange Membrane of All-Vanadium Redox Flow Battery Market Size (Million USD) Comparison by Regions (2012-2022) Regions 2012 2016 2022 Market Share (%) in 2022 xx% xx% Growth Rate (2016-2022) xx% xx% NorthAmerica Europe XX XX XX XX XX XX Email: sales@qyresearch.com; Tel: 001-6262952442 0086-1082945717; www.qyresearch.com
2017 Market Research Report on Global Ion Exchange Membrane ofAll-Vanadium Redox Flow Battery Industry China Japan ROW Total Source: Annual Reports, Secondary Information, Press Releases, Expert Interviews and QYResearch, May 2017 XX XX XX XX XX XX XX XX XX XX XX XX xx% xx% xx% 100% xx% xx% xx% xx% 1.4.2 North America Ion Exchange Membrane of All-Vanadium Redox Flow Battery Status and Prospect (2012-2022) The North America Ion Exchange Membrane of All-Vanadium Redox Flow Battery market size was XX million USD in 2016 and it will be XX million USD in 2022, with a Growth Rate XX% from 2016 to 2022. Figure North America Ion Exchange Membrane of All-Vanadium Redox Flow Battery Revenue (Million USD) and Growth Rate (2012-2022) Source: Experts Interview, Secondary Sources and QYR Chemical & Material Research Center, May 2017 Email: sales@qyresearch.com; Tel: 001-6262952442 0086-1082945717; www.qyresearch.com
2017 Market Research Report on Global Ion Exchange Membrane ofAll-Vanadium Redox Flow Battery Industry 1.4.3 China Ion Exchange Membrane of All-Vanadium Redox Flow Battery Status and Prospect (2012-2022) The China Ion Exchange Membrane of All-Vanadium Redox Flow Battery market size was XX million USD in 2016 and it will be XX million USD in 2022, with a Growth Rate XX% from 2016 to 2022. Figure China Ion Exchange Membrane of All-Vanadium Redox Flow Battery Revenue (Million USD) and Growth Rate (2012-2022) Source: Experts Interview, Secondary Sources and QYR Chemical & Material Research Center, May 2017 1.4.4 Europe Ion Exchange Membrane of All-Vanadium Redox Flow Battery Status and Prospect (2012-2022) The Europe Ion Exchange Membrane of All-Vanadium Redox Flow Battery market size was XX million USD in 2016 and it will be XX million USD in 2022, with a Growth Rate XX% from 2016 to 2022. Email: sales@qyresearch.com; Tel: 001-6262952442 0086-1082945717; www.qyresearch.com
2017 Market Research Report on Global Ion Exchange Membrane ofAll-Vanadium Redox Flow Battery Industry Figure Europe Ion Exchange Membrane of All-Vanadium Redox Flow Battery Revenue (Million USD) and Growth Rate (2012-2022) Source: Experts Interview, Secondary Sources and QYR Chemical & Material Research Center, May 2017 1.4.5 Japan Ion Exchange Membrane of All-Vanadium Redox Flow Battery Status and Prospect (2012-2022) The Japan Ion Exchange Membrane of All-Vanadium Redox Flow Battery market size was XX million USD in 2016 and it will be XX million USD in 2022, with a Growth Rate XX% from 2016 to 2022. Email: sales@qyresearch.com; Tel: 001-6262952442 0086-1082945717; www.qyresearch.com
2017 Market Research Report on Global Ion Exchange Membrane ofAll-Vanadium Redox Flow Battery Industry Figure Japan Ion Exchange Membrane of All-Vanadium Redox Flow Battery Revenue (Million USD) and Growth Rate (2012-2022) Source: Experts Interview, Secondary Sources and QYR Chemical & Material Research Center, May 2017 1.5 Global Ion Exchange Membrane of All-Vanadium Redox Flow Battery Market Size (2012-2022) 1.5.1 Global Ion Exchange Membrane of All-Vanadium Redox Flow Battery Revenue (Million USD) Status and Outlook (2012-2022) The global Ion Exchange Membrane of All-Vanadium Redox Flow Battery market is valued at USD XX million in 2016 and is expected to reach USD XX million by the end of 2022, growing at a Growth Rate of XX% between 2016 and 2022. Email: sales@qyresearch.com; Tel: 001-6262952442 0086-1082945717; www.qyresearch.com
2017 Market Research Report on Global Ion Exchange Membrane ofAll-Vanadium Redox Flow Battery Industry Figure Global Ion Exchange Membrane of All-Vanadium Redox Flow Battery Revenue (Million USD) Status and Outlook (2012-2022) Source: Experts Interview, Secondary Sources and QYR Chemical & Material Research Center, May 2017 1.5.2 Global Ion Exchange Membrane of All-Vanadium Redox Flow Battery Capacity, Production (K Units) Status and Outlook (2012-2022) In terms of volume, the global Ion Exchange Membrane of All-Vanadium Redox Flow Battery Production was XX in Europe in 2016, and it is predicted to reach XX in 2022. Email: sales@qyresearch.com; Tel: 001-6262952442 0086-1082945717; www.qyresearch.com
2017 Market Research Report on Global Ion Exchange Membrane ofAll-Vanadium Redox Flow Battery Industry Figure Global Ion Exchange Membrane of All-Vanadium Redox Flow Battery Capacity, Production (K Units) Status and Outlook (2012-2022) Source: Experts Interview, Secondary Sources and QYR Chemical & Material Research Center, May 2017 Email: sales@qyresearch.com; Tel: 001-6262952442 0086-1082945717; www.qyresearch.com
2017 Market Research Report on Global Ion Exchange Membrane ofAll-Vanadium Redox Flow Battery Industry 2 Global Ion Exchange Membrane of All-Vanadium Redox Flow Battery Market Competition by Manufacturers 2.1 Global Ion Exchange Membrane of All-Vanadium Redox Flow Battery Capacity, Production and Share by Manufacturers (2012-2017) The top players cover Chemours (DuPont), FuMa-Tech, Golden Energy Fuel Cell, Dalian Institute of Chemical Physics and Company five etc., which are playing important roles in global Ion Exchange Membrane ofAll-Vanadium Redox Flow Battery market. 2.1.1 Global Ion Exchange Membrane of All-Vanadium Redox Flow Battery Capacity (K Units) and Share (%) by Manufacturers (2012-2017) Figure Global Ion Exchange Membrane of All-Vanadium Redox Flow Battery Major Players Product Capacity (K Units) 2012-2017 Source: Above companies; Secondary Sources, Press Releases, Expert Interviews and QYR Chemical & Material Research Center Table Global Ion Exchange Membrane of All-Vanadium Redox Flow Battery Capacity (K Units) of Key Manufacturers (2012-2017) Capacity Chemours (DuPont) FuMa-Tech Golden Energy Fuel Cell Dalian Institute of Chemical Physics Company five 2012 2013 2014 2015 2016 2017 Email: sales@qyresearch.com; Tel: 001-6262952442 0086-1082945717; www.qyresearch.com
2017 Market Research Report on Global Ion Exchange Membrane ofAll-Vanadium Redox Flow Battery Industry … … Total Source: Above companies; Secondary Sources, Press Releases, Expert Interviews and QYR Chemical & Material Research Center Table Global Ion Exchange Membrane of All-Vanadium Redox Flow Battery Capacity Market Share (%) of Key Manufacturers (2012-2017) Capacity Chemours (DuPont) FuMa-Tech Golden Energy Fuel Cell Dalian Institute of Chemical Physics Company five 2012 2013 2014 2015 2016 2017 … … Total Source: Above companies; Secondary Sources, Press Releases, Expert Interviews and QYR Chemical & Material Research Center Figure Global Ion Exchange Membrane of All-Vanadium Redox Flow Battery Capacity Market Share (%) of Key Manufacturers in 2016 Source: Above companies; Secondary Sources, Press Releases, Expert Interviews and QYR Chemical & Material Research Center Figure Global Ion Exchange Membrane of All-Vanadium Redox Flow Battery Capacity Market Share (%) of Key Manufacturers in 2017 Source: Above companies; Secondary Sources, Press Releases, Expert Interviews and QYR Chemical & Material Research Center Email: sales@qyresearch.com; Tel: 001-6262952442 0086-1082945717; www.qyresearch.com
2017 Market Research Report on Global Ion Exchange Membrane ofAll-Vanadium Redox Flow Battery Industry 2.1.2 Global Ion Exchange Membrane of All-Vanadium Redox Flow Battery Production (K Units) and Share (%) by Manufacturers (2012-2017) Figure Global Ion Exchange Membrane of All-Vanadium Redox Flow Battery Major Players Product Production (K Units) 2012-2017 Source: Above companies; Secondary Sources, Press Releases, Expert Interviews and QYR Chemical & Material Research Center Table Global Ion Exchange Membrane of All-Vanadium Redox Flow Battery Production (K Units) of Key Manufacturers (2012-2017) Production Chemours (DuPont) FuMa-Tech Golden Energy Fuel Cell Dalian Institute of Chemical Physics Company five 2012 2013 2014 2015 2016 2017 … … Total Source: Above companies; Secondary Sources, Press Releases, Expert Interviews and QYR Chemical & Material Research Center Email: sales@qyresearch.com; Tel: 001-6262952442 0086-1082945717; www.qyresearch.com
2017 Market Research Report on Global Ion Exchange Membrane ofAll-Vanadium Redox Flow Battery Industry Table Global Ion Exchange Membrane of All-Vanadium Redox Flow Battery Production Share (%) by Manufacturers (2012-2017) Production Share (%) Chemours (DuPont) FuMa-Tech 2012 2013 2014 2015 2016 2017 … … Total Source: Above companies; Secondary Sources, Press Releases, Expert Interviews and QYR Chemical & Material Research Center Figure 2016 Ion Exchange Membrane of All-Vanadium Redox Flow Battery Production Share (%) by Manufacturers Source: Above companies; Secondary Sources, Press Releases, Expert Interviews and QYR Chemical & Material Research Center Figure 2016 Ion Exchange Membrane of All-Vanadium Redox Flow Battery Production Share (%) by Manufacturers Source: Above companies; Secondary Sources, Press Releases, Expert Interviews and QYR Chemical & Material Research Center Email: sales@qyresearch.com; Tel: 001-6262952442 0086-1082945717; www.qyresearch.com
2017 Market Research Report on Global Ion Exchange Membrane ofAll-Vanadium Redox Flow Battery Industry 2.2 Global Ion Exchange Membrane of All-Vanadium Redox Flow Battery Revenue (Million USD) and Share (%) by Manufacturers (2012-2017) Figure Global Ion Exchange Membrane of All-Vanadium Redox Flow Battery Major Players Product Revenue (Million USD) 2012-2017 Source: Above companies; Secondary Sources, Press Releases, Expert Interviews and QYR Chemical & Material Research Center Table Global Ion Exchange Membrane of All-Vanadium Redox Flow Battery Revenue (Million USD) by Manufacturers (2012-2017) Revenue Chemours (DuPont) FuMa-Tech 2012 2013 2014 2015 2016 2017 … … Total Source: Above companies; Secondary Sources, Press Releases, Expert Interviews and QYR Chemical & Material Research Center Table Global Ion Exchange Membrane of All-Vanadium Redox Flow Battery Revenue Share (%) by Manufacturers (2012-2017) Revenue Share Chemours (DuPont) FuMa-Tech 2012 2013 2014 2015 2016 2017 … … Total Source: Above companies; Secondary Sources, Press Releases, Expert Interviews and QYR Chemical & Material Research Center Email: sales@qyresearch.com; Tel: 001-6262952442 0086-1082945717; www.qyresearch.com
2017 Market Research Report on Global Ion Exchange Membrane ofAll-Vanadium Redox Flow Battery Industry Table 2016 Global Ion Exchange Membrane of All-Vanadium Redox Flow Battery Revenue Share (%) by Manufacturers Source: Above companies; Secondary Sources, Press Releases, Expert Interviews and QYR Chemical & Material Research Center Table 2016 Global Ion Exchange Membrane of All-Vanadium Redox Flow Battery Revenue Share (%) by Manufacturers Source: Above companies; Secondary Sources, Press Releases, Expert Interviews and QYR Chemical & Material Research Center 2.3 Global Ion Exchange Membrane of All-Vanadium Redox Flow Battery Average Price (USD/Unit) by Manufacturers (2012-2017) Table Global Market Ion Exchange Membrane of All-Vanadium Redox Flow BatteryAverage Price (USD/Unit) of Key Manufacturers (2012-2017) 2012 2013 2014 2015 2016 2017 Chemours (DuPont) FuMa-Tech … … Total Source: Above companies; Secondary Sources, Press Releases, Expert Interviews and QYR Email: sales@qyresearch.com; Tel: 001-6262952442 0086-1082945717; www.qyresearch.com
2017 Market Research Report on Global Ion Exchange Membrane ofAll-Vanadium Redox Flow Battery Industry Chemical & Material Research Center Figure Global Market Ion Exchange Membrane of All-Vanadium Redox Flow BatteryAverage Price (USD/Unit) of Key Manufacturers in 2016 Source: Above companies; Secondary Sources, Press Releases, Expert Interviews and QYR Chemical & Material Research Center 2.4 Manufacturers Ion Exchange Membrane of All-Vanadium Redox Flow Battery Manufacturing Base Distribution, SalesArea, Product Types Table Manufacturers Ion Exchange Membrane of All-Vanadium Redox Flow Battery Manufacturing Base Distribution and Sales Area Manufacturing Base Distribution SalesArea Chemours (DuPont) FuMa-Tech … … Source: Above companies; Secondary Sources, Press Releases, Expert Interviews and QYR Chemical & Material Research Center Email: sales@qyresearch.com; Tel: 001-6262952442 0086-1082945717; www.qyresearch.com
2017 Market Research Report on Global Ion Exchange Membrane ofAll-Vanadium Redox Flow Battery Industry Table Manufacturers Ion Exchange Membrane of All-Vanadium Redox Flow Battery Product Category Product Types Chemours (DuPont) FuMa-Tech … … Source: Above companies; Secondary Sources, Press Releases, Expert Interviews and QYR Chemical & Material Research Center 2.5 Ion Exchange Membrane of All-Vanadium Redox Flow Battery Market Competitive Situation and Trends 2.5.1 Ion Exchange Membrane of All-Vanadium Redox Flow Battery Market Concentration Rate 2.5.2 Ion Exchange Membrane of All-Vanadium Redox Flow Battery Market Share (%) of Top 3 and Top 5 Manufacturers Figure Ion Exchange Membrane of All-Vanadium Redox Flow Battery Market Share (%) of Top 3 Manufacturers Source: Above companies; Secondary Sources, Press Releases, Expert Interviews and QYR Chemical & Material Research Center Figure Ion Exchange Membrane of All-Vanadium Redox Flow Battery Market Share (%) of Top 5 Manufacturers Source: Above companies; Secondary Sources, Press Releases, Expert Interviews and QYR Chemical & Material Research Center Email: sales@qyresearch.com; Tel: 001-6262952442 0086-1082945717; www.qyresearch.com
2017 Market Research Report on Global Ion Exchange Membrane ofAll-Vanadium Redox Flow Battery Industry 2.5.3 Mergers &Acquisitions, Expansion Email: sales@qyresearch.com; Tel: 001-6262952442 0086-1082945717; www.qyresearch.com
2017 Market Research Report on Global Ion Exchange Membrane ofAll-Vanadium Redox Flow Battery Industry 3 Global Ion Exchange Membrane of All-Vanadium Redox Flow Battery Production by Regions (2012-2017) 3.1 Global Ion Exchange Membrane of All-Vanadium Redox Flow Battery Capacity (K Units) and Market Share (%) by Regions (2012-2017) Table Global Ion Exchange Membrane of All-Vanadium Redox Flow Battery Capacity (K Units) by Regions (2012-2017) 2012 2013 2014 2015 2016 2017 NorthAmerica Europe China Japan ROW Total Source: Experts Interview, Secondary Sources and QYR Chemical & Material Research Center, May 2017 Figure Global Ion Exchange Membrane of All-Vanadium Redox Flow Battery Capacity Market Share (%) by Regions (2012-2017) 2012 2013 2014 2015 2016 2017 NorthAmerica Europe China Japan ROW Total Source: Experts Interview, Secondary Sources and QYR Chemical & Material Research Center, May 2017 Email: sales@qyresearch.com; Tel: 001-6262952442 0086-1082945717; www.qyresearch.com
2017 Market Research Report on Global Ion Exchange Membrane ofAll-Vanadium Redox Flow Battery Industry Figure Global Ion Exchange Membrane of All-Vanadium Redox Flow Battery Capacity Market Share (%) by Regions (2012-2017) Source: Experts Interview, Secondary Sources and QYR Chemical & Material Research Center, May 2017 Figure 2016 Global Ion Exchange Membrane of All-Vanadium Redox Flow Battery Capacity Market Share (%) by Regions Source: Experts Interview, Secondary Sources and QYR Chemical & Material Research Center, May 2017 Email: sales@qyresearch.com; Tel: 001-6262952442 0086-1082945717; www.qyresearch.com
2017 Market Research Report on Global Ion Exchange Membrane ofAll-Vanadium Redox Flow Battery Industry 3.2 Global Ion Exchange Membrane of All-Vanadium Redox Flow Battery Production (K Units) and Market Share (%) by Regions (2012-2017) Table Global Ion Exchange Membrane of All-Vanadium Redox Flow Battery Production (K Units) by Regions (2012-2017) 2012 2013 2014 2015 2016 2017 NorthAmerica Europe China Japan ROW Total Source: Secondary Sources and QYR Chemical & Material Research Center, May 2017 Figure Global Ion Exchange Membrane of All-Vanadium Redox Flow Battery Production Market Share (%) by Regions (2012-2017) 2012 2013 2014 2015 2016 2017 NorthAmerica Europe China Japan ROW Total Source: Secondary Sources and QYR Chemical & Material Research Center, May 2017 Email: sales@qyresearch.com; Tel: 001-6262952442 0086-1082945717; www.qyresearch.com