Download
1 / 34
340 likes | 447 Views
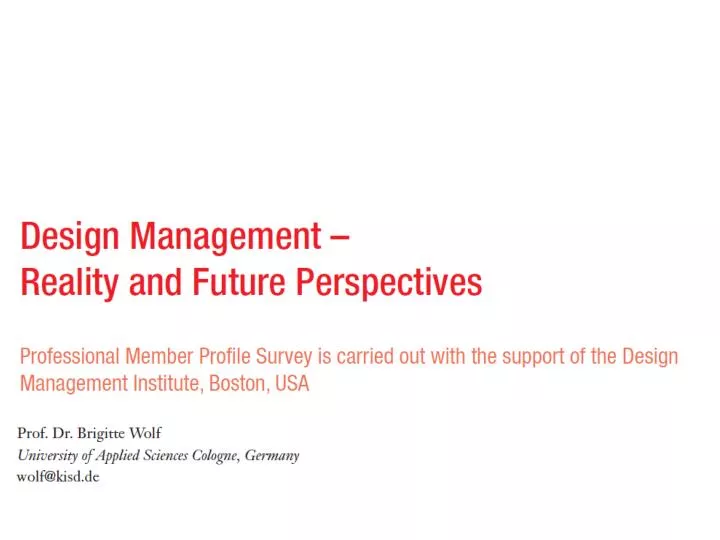
OBJECTIVE OF PAPER From October 2001 to February 2002 Prof. Dr. Brigette Wolf spent sabbatical as a Senior Research Fellow of the Design Management Institute (DMI) at the DMI in Boston.

E N D
OBJECTIVE OF PAPER From October 2001 to February 2002 Prof. Dr. Brigette Wolf spent sabbatical as a Senior Research Fellow of the Design Management Institute (DMI) at the DMI in Boston. The objective was to explore the reality of design management in the US. Therefore she prepared in cooperation with the DMI a survey on the conditions, challenges, and perspectives of professional work of the DMI members. The Design Management Institute emailed the questionnaire in February 2002 to all its members. The questionnaire was comprised of multiple choice questions and a number of open ended questions. Included were questions concerning personal data, work place, income, education, and future challenges.
INFERENCE • About one quarter of the responding DMI members are female and three quarters are male. • In the consultancies exactly 25 % of the respondents are female and 75 % are male. • For corporationsthe percentages differ slightly, where 30% of the respondents are female and 70% are male. • Over 70 % of the respondents are between thirty and fifty years old. • In Non US countries, nearly 80 % are between thirty and fifty years of age
Education Most of the respondents, namely 41%, have a bachelor degree, whereas 26% of the respondents have a master degree. 17% of the respondents have studied at some graduate school, while only 4 respondents or 1.6% have a PhD.
Only a small percentage of the respondents works less than 40 hours a week. The majority is working between 50 and 59 hours weekly. There is a slight tendency for employees of design consultancies to work more hours than those working in corporations.
Overall, respondents like their jobs. They find them challenging and interesting because they are working with a great variety of talented people and top specialists. Listed below is a sampling of the responses regarding positive aspects of job received most often. “The people I work with. The environment I work in. The benefits of constantly learning. New design challenges on a daily basis.” “The people: staff, clients, and a great boss. Opportunities for professional growth, creative freedom, and the challenge to improve” “Great group of people I manage, and a great group of engineering and marketing peers. We are well respected at high levels (VPs) for how good we are, and, to some extent, for our overall value. That is reflected in how well I have been rewarded personally.” “ Working with clients. Solving problems and coming up with great discoveries.”
Job Concerns 38 out of 250 respondents did not comment on their job concerns and only 11 people said that they have no concerns. Of those responding, the main concerns are maintaining the business, the job and the compensation. “ The job may disappear or change due to an acquisition event.” “Competition is increasing, and clients don't always understand why good design costs. Competing with freelancers and lower hourly rates is my biggest challenge.” “ Though design is making great progress, the company overall is struggling to survive—my position might be eliminated” “ The market demand for our (high) level of design services is currently weak. Budgets are smaller, and clients are not spending money.”
Consultancy client’s areas of Industry • Consumer Goods • Agriculture • Transportation • • Finance • • Insurance • • Government and law • • Health and Healthcare • • Telecommunications • • Entertainment • • Food and Beverage • • Education • • Defense • Science and Technology • • Information technology • • Services • • Travel and leisure • • Marketing • • Manufacturing • • Retail • • Fashion • • Real estate development • • Utilities • • Marketing
Annual compensation in corporations and design consultancies About 10% of the respondents did not respond to this question. Of those that did answer, the participants working in design consultancies are the higher earners. The largest percentage of respondents, 23.7%, are from corporations and they are earning between 75,000 and 99,000 US$. The largest percentage of respondents from design consultancies, 20.6%, earn more than 200,000 US$ a year
Primary areas of Expertise The primary areas of expertise of a corporations in-house design department and a design consultancy differ. For design consultancies the strategic aspects of design are the most important areas of expertise. While for a corporate in-house design department, graphic design is the most important area of expertise.
Others include Brand strategy, creative strategy, business development, communication strategy, corporate management, design strategy, general management, information design, innovation consultancy, interaction design.