Download
1 / 15
150 likes | 446 Views
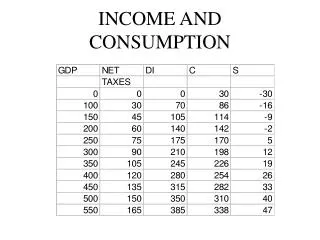
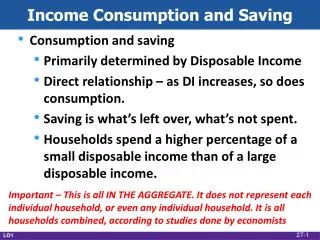
Income Consumption and Saving. Consumption and saving Primarily determined by Disposable Income Direct relationship – as DI increases, so does consumption. Saving is what’s left over, what’s not spent.

E N D
Income Consumption and Saving • Consumption and saving • Primarily determined by Disposable Income • Direct relationship – as DI increases, so does consumption. • Saving is what’s left over, what’s not spent. • Households spend a higher percentage of a small disposable income than of a large disposable income. Important – This is all IN THE AGGREGATE. It does not represent each individual household, or even any individual household. It is all households combined, according to studies done by economists 27-1 LO1
Income, Consumption, and Saving 27-2 LO1
Consumption and Saving Schedules 27-3 LO1
500 475 450 425 400 375 45° 50 25 0 • 390 410 430 450 470 490 510 530 550 Consumption and Saving Schedules C Saving $5 billion Consumption schedule Consumption (billions of dollars) Dissaving $5 billion • 390 410 430 450 470 490 510 530 550 Dissaving $5 billion Saving schedule S Saving (billions of dollars) Saving $5 billion Disposable income (billions of dollars) 27-4 LO1
Average Propensities • Average propensity to consume (APC) • Fraction of total income consumed • Average propensity to save (APS) • Fraction of total income saved consumption saving APC = APS = income income APC + APS = 1 27-5 LO1
Global Perspective 27-6 LO1
Marginal Propensities • Marginal propensity to consume (MPC) • Proportion of a change in income consumed • Marginal propensity to save (MPS) • Proportion of a change in income saved change in consumption change in saving MPC = MPS = change in income change in income MPC + MPS = 1 27-7 LO1
Marginal Propensities C 5 20 15 20 MPC = = .75 Consumption C ($15) DI ($20) S MPS = = .25 Saving S ($5) DI ($20) Disposable income 27-8 LO1
Nonincome Determinants • Amount of disposable income is the main determinant • Other determinants • Wealth • Expectations • Real interest rates • Household Debt • Taxation – the only one that shifts both consumption and saving in the same direction. 27-9 LO2
45° Shifts of C & S Schedules C1 C0 C2 Consumption (billions of dollars) 0 S2 S0 + S1 Saving (billions of dollars) 0 - Disposable Income (billions of dollars) 27-10 LO2
Interest-Rate-Investment • Expected rate of return and the real interest rate. • If the expected rate of return is greater than the real interest rate, then the firm should undertake the investment. • Applies to borrowing or to cash on hand. 27-11 LO3
16 14 12 10 8 6 4 2 0 Expected rate of return, r and real interest rate, i (percents) 5 10 15 20 25 30 35 40 Investment (billions of dollars) Investment Demand Curve Investment demand curve ID 27-12 LO3
Shifts of Investment Demand • Acquisition, maintenance, and operating costs • Business taxes • Technological change • Stock of capital goods on hand • Planned inventory changes • Expectations 27-13 LO4
Shifts of Investment Demand Increase in investment demand Expected rate of return, r, and real interest rate, i (percents) Decrease in investment demand ID1 ID0 ID2 0 Investment (billions of dollars) 27-14 LO4
Global Perspective 27-15 LO4