Download
1 / 32
580 likes | 1.67k Views
BCG Matrix – A Business Portfolio Tool. By: Shruti Gupta. What is Business Portfolio?. Methods of Portfolio Planning. The two best-known portfolio planning methods are from the Boston Consulting Group and by General Electric/Shell: BCG Matrix GE Matrix. BCG Matrix – An Introduction.

E N D
BCG Matrix – A Business Portfolio Tool By: Shruti Gupta
Methods of Portfolio Planning The two best-known portfolio planning methods are from the Boston Consulting Group and by General Electric/Shell: • BCG Matrix • GE Matrix
BCG Matrix – An Introduction • The BCG matrix model was developed by Bruce Henderson of the Boston Consulting Group in the early 1970's. • The BCG matrix/ BCG model is the most renowned corporate portfolio analysis tool.
The first step in BCG Matrix is to identify the various Strategic Business Units ("SBU's") in a company portfolio. • According to this technique, businesses or products are classified as low or high performers depending upon their market growth rate and relative market share. • Relative market share - this serves as a measure of SBU strength in the market • Market growth rate - this provides a measure of market attractiveness
WHY BCG MATRIX? To assess: • Profiles of products/businesses • The cash demands of products • The development cycles of products • Resource allocation and divestment decisions
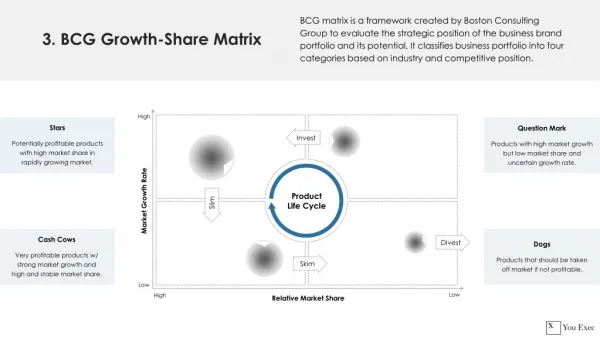
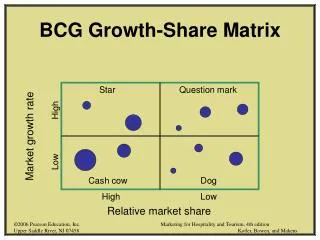
It is a portfolio planning model which is based on the observation that a company’s business units can be classified in to four categories: • STARS • QUESTION MARKS • CASH COWS • DOGS
THE BCG MATRIX COMPONENTS • Stars – High market share and High growth rate (high competition) • Cash Cows – High market share but low growth rate (most profitable) • Question marks – Low market share and high growth rate (uncertainty) • Dogs – Low market share and low growth rate (less profitable or may even be negative profitability)
STARS HIGH GROWTH, HIGH MARKET SHARE • Stars are leaders in business. • They require heavy investment to maintain its large market share. • It leads to a large amount of cash consumption and cash generation. • Attempts should be made to hold the market share otherwise the star will become a cash cow.
CASH COWS LOW GROWTH, HIGH MARKET SHARE • They are foundation of the company and often the stars of yesterday. • They generate more cash than required. • They extract the profits by investing as little cash as possible. • They are located in an industry that is mature, not growing or declining.
QUESTION MARKS HIGH GROWTH , LOW MARKET SHARE • Most businesses start of as question marks. • They will absorb great amounts of cash if the market share remains unchanged • Question marks have potential to become star and eventually cash cow but can also become a dog. • Investments should be high for question marks.
DOGS LOW GROWTH, LOW MARKET SHARE • Dogs are the cash traps. • Dogs do not have potential to bring in much cash. • Business is situated at a declining stage.
Strategies based on the BCG Matrix There are four strategies possible for any product / SBU under the BCG analysis. These are: • Build – By increasing investment, the product is given an impetus such that the product increases its market share. Make further investments (for example, to maintain Star status, or to turn a Question Mark into a Star). • Hold – The company cannot invest. Maintain the status quo (do nothing). The company invests just enough to keep the SBU in its present position. Example – Holding a star there itself as higher investment to move a star into cash cow is currently not possible. 3) Harvest – Best observed in the Cash cow scenario, wherein the company reduces the amount of investment and tries to take out maximum cash flow from the said product which increases the overall profitability. 4) Divest – Best observed in case of Dog quadrant products which are generally divested to release the amount of money already stuck in the business.
ADVANTAGES OF BCG-MATRIX • It is simple and easy to understand. • It helps to quickly and simply screen the open opportunities, and helps in thinking as to how one can make the most of them. • It is used to identify how corporate cash resources can best be used to maximize a company’s future growth and profitability.
LIMITATIONS OF BCG-MATRIX • It uses only two dimensions i.e., Relative market share and market growth rate. • Problems of getting data on market share and market growth. • High market share does not mean profits all the time. • Business with low market share can be profitable too.
Example: COCA COLA • Coca-cola Company returned to India in 1993 after a gap of 16 years after nourishing the global community with the world’s largest selling soft drink since 1886. • HCCB (Hindustan Coca Cola Beverages Ltd.) serves in India some of the most recalled brands across the world including names such as Coca-cola, Sprite, Fanta, Thumbs up, Limca, Maaza and Kinley (packaged drinking water), Minute maid pulpy orange, etc. • The business system of the company in India directly employs approximately 6,000 people, and indirectly creates employment for many more. Coca-Cola India has increased its market share from 57 percent in the carbonated soft drink (CDs)category in 2005 to 61 percent at the end of December 2006. • Coca Cola was the first in the country to launch cans, plastic cap leak proof bottles and full length delivery crates. • Ranking: They own 4 of the world’s top 5 non-alcoholic sparkling beverage brands: Coca-Cola, Diet Coke, Sprite and Fanta. • Company Associates: 90,500 worldwide (December 31, 2007) • Operational Reach: 200+ countries • Consumer Servings (per day): 1.5 billion.
Mission: Our Roadmap starts with our mission, which is enduring. It declares our purpose as a company and serves as the standard against which we weigh our actions and decisions. • To refresh the world.. • To inspire moments of optimism and happiness • To create value and make a difference Vision: Our vision serves as the framework for our Roadmap and guides every aspect of our business by describing what we need to accomplish in order to continue achieving sustainable, quality growth. • People: Be a great place to work where people are inspired to be the best they can be • Portfolio: Bring to the world a portfolio of quality beverage brands that anticipate and satisfy people’s desires and needs • Partners: Nurture a winning network of customers and suppliers, together we create mutual, enduring value • Planet: Be a responsible citizen that makes a difference by helping build and support sustainable communities • Profit: Maximize long-term return to share owners while being mindful of our overall responsibilities • Productivity: Be a highly effective, lean and fast-moving organization
Strength • Strong leading brands with high level of consumer acceptance – this allows the company to extend its products to attract new customers • Large scale of operations – Coca-Cola products are already sold in 200 countries. • Leading market position – the brand has a large market about 5% ahead of its main competitor PepsiCo. • Strong cash flows from operations- the brand is able to create over $ 50million a day.
Weakness • Impact of Financial market volatility which in turn affects the liquidity position of the company. • Slow decision making can give competitive advantage to the competitors such as PepsiCo may be the first to introduce a product.
Opportunities • Global growth in non-alcoholic ready-to-drink beverage industry- this trend is set to generate retail sale in the industry to more than $1trillion by 2020. • Growing global bottle water market • Booming global functional drinks market e.g. energy drink. • Target the ageing customers and the young and more environmental concern people
Threat • Economic climate – countries from all over the world have felt the impacts of the current recession. This may be a problem for Coke, which derives approximately 75% of its sales from outside North America. • Health and wellness has created a concern for carbonated products specially in the USA and Europe. • Overdependence on bottling partners • Intense competition – either local or global market.
BCG-MATRIX FOR THE PRODUCT LINE OF COCA-COLA STARS - HIGH GROWTH, HIGH MARKET SHARE • Thumbs up, Maaza, Kinley CASH COWS - LOW GROWTH, HIGH MARKET SHARE • Limca, Coca Cola QUESTION MARKS - HIGH GROWTH , LOW MARKET SHARE • Fanta, sprite DOGS - LOW GROWTH, LOW MARKET SHARE • Diet Coke, Minute maid
From the diagram we can conclude that:- INTRODUCTION STAGE:- • FANTA & SPRITE are at the introduction stage , as both are much new in the market as compared to thumbs up and limca. GROWTH STAGE:- • THUMBS UP, KINLEY & MAZAA are at the growth stage having high growth and low market share. MATURITY STAGE: • LIMCA, COCA-COLA are at the maturity stage having low growth but high market share. DECLINE STAGE:- • DIET COKE, MINUTE MADE PULPY ORANGE & KINLEY SODA are at the decline stage, proving to be non profitable products having low growth and low market share.
Conclusion • LIFE CYCLE: To be able to market its product properly, a firm must be aware of the product life cycle of its product. The standard product life cycle tends to have five phases: Development, Introduction, Growth, Maturity and Decline. • Star Strategy: Invest profits for future growth and for earning more of market share and profits. • Cash Cow Strategy: Use profits to finance new products and growth elsewhere. • Question Mark Strategy: Either invest heavily in order to push the products to star status, or divest in order to avoid it becoming a Dog. • Dog Strategy: Either invest to earn market share or consider disinvesting. Thus the BCG matrix is the best way for a business portfolio analysis. The strategies recommended after BCG analysis help the firm decide on the right line of action and help them implement the same.
Thank youAny Questions pls? Disclaimer Clause: Views expressed in this presentation views of the author do not necessary reflect those of the Institute.